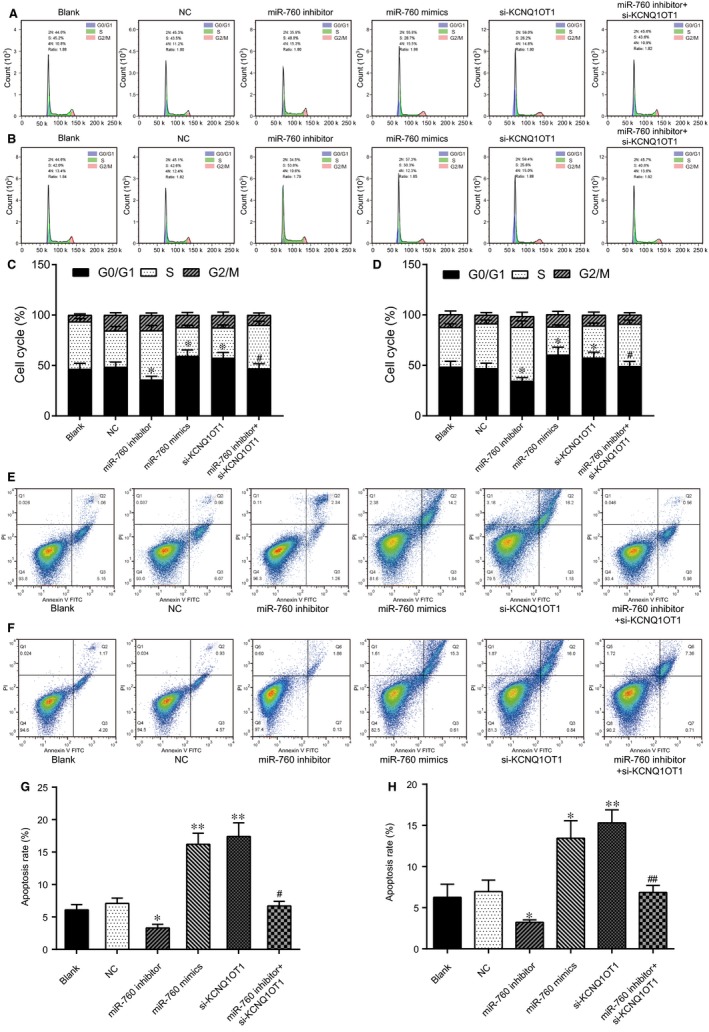
Figure 6.

Silencing of KCNQ1OT1 influenced cell cycle progression and apoptosis in MTX‐resistant CRC cells through the sponging of miR‐760 (A, C) The cell cycle stage was determined by flow cytometry in HT29/MTX cells to explore the effect of the KCNQ1OT1/miR‐760 axis. *P < 0.05 compared with the NC group, #P < 0.05 compared with the miR‐760 inhibitor group. (B, D) The cell cycle stage was determined by flow cytometry in Caco2 and Caco2/MTX cells to explore the effect of the KCNQ1OT1/miR‐760 axis. *P < 0.05 compared with the NC group, #P < 0.05 compared with the miR‐760 inhibitor group. (E, G) Cell apoptosis was detected by flow cytometry in HT29/MTX cells to explore the effect of the KCNQ1OT1/miR‐760 axis. *P < 0.05 compared with the NC group, #P < 0.05 compared with the miR‐760 inhibitor group. (F, H) Cell apoptosis was detected by flow cytometry in Caco2/MTX cells to explore the effect of the KCNQ1OT1/miR‐760 axis. *P < 0.05 compared with the NC group, #P < 0.05 compared with the miR‐760 inhibitor group
