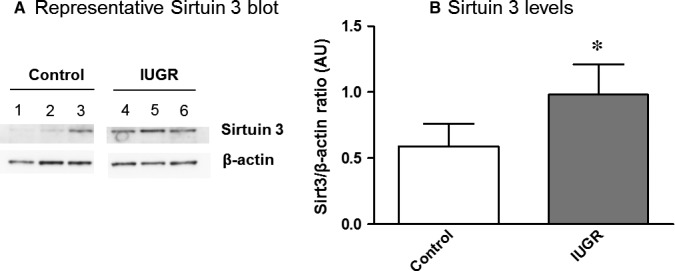
Figure 3.

Sirtuin3 protein levels in placenta of the study groups. A, A representative Western Blot of Sirtuin3 protein expression in human placenta is shown in both controls (1‐3) and IUGR pregnancies (4‐6). β‐actin was used as the loading control. B, Graph showing the significant increase of Sirtuin3 levels (Sirt3/β‐actin ratio) in IUGR pregnancies (grey bars) compared with controls (empty bars). Results are expressed as mean ± SEM. Mann‐Whitney tests were used to seek for statistical analysis between groups. AU, Arbitrary units; IUGR, Intrauterine growth restriction; Sirt3, Sirtuin3; *P < 0.05
