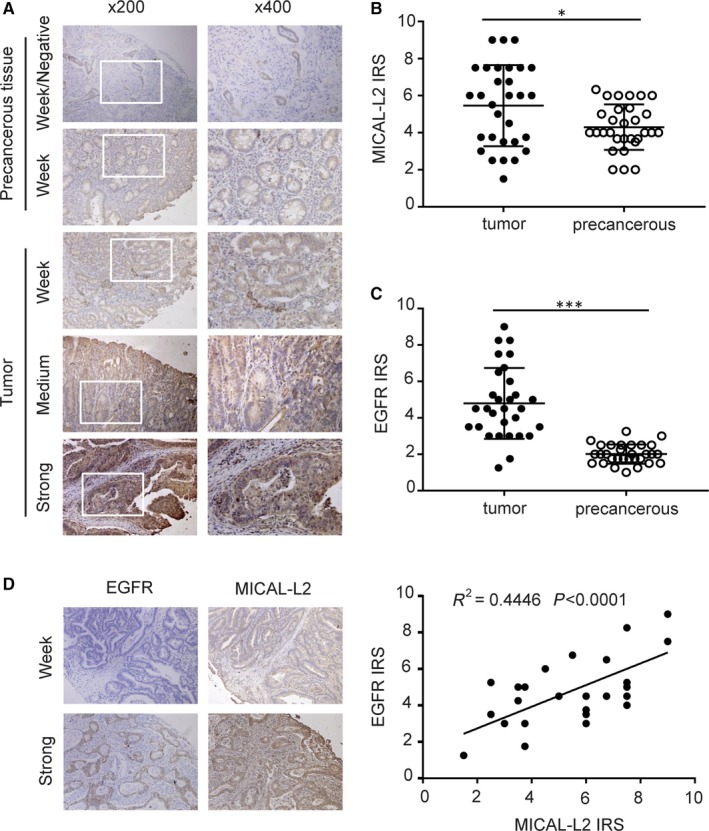
Figure 7.

Analysis of MICAL‐L2 and EGFR expressions in gastric cancer tissues. A, Representative images of MICAL‐L2 staining in gastric cancer tissues are shown. The positive staining of MICAL‐L2 is shown in brown colour and the cell nuclei were counterstained with haematoxylin. (B, C) Analysed for MICAL‐L2 and EGFR staining in gastric cancer tissue by IRS scores. D, Using serial sections of the same sample, representative malignant gastric cancer tissue and paracancerous tissue stained for MICAL‐L2 and EGFR are shown. The scatterplot of correlated protein levels between MICAL‐L2 and EGFR in gastric cancer tissue (n = 30) and paracancerous tissue (n = 30). *P < 0.05, ***P < 0.001
