Figure 2.

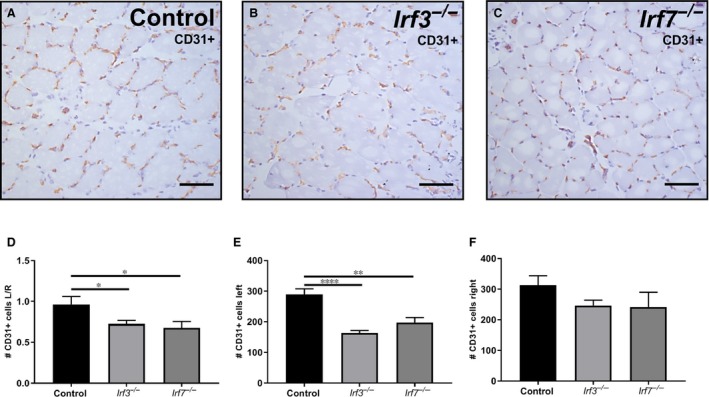
Angiogenesis in CD31+ stained soleus muscles. Representative image of the left ischaemic soleus muscle stained with CD31 (20× magnification) of (A) C57BL/6 mice (B) Irf3−/−mice and (C) Irf7−/− mice sacrificed 28 days after surgery (D) Ratio of the number of CD31+ cells in the soleus muscle of left ischaemic/right non‐ischaemic is shown. (E) The number of CD31+ cells in the soleus muscle of the left ischaemic calf is shown. (F) The number of CD31+ cells in the soleus muscle of the right non‐ischaemic calf is shown. Data is presented as mean SEM; *P < 0.05; **P < 0.01, ****P < 0.0001, a 2‐tailed Student's t test was used. C57BL/6 n = 6, Irf3−/− n = 9, Irf7−/− n = 6
