Fig. 3.
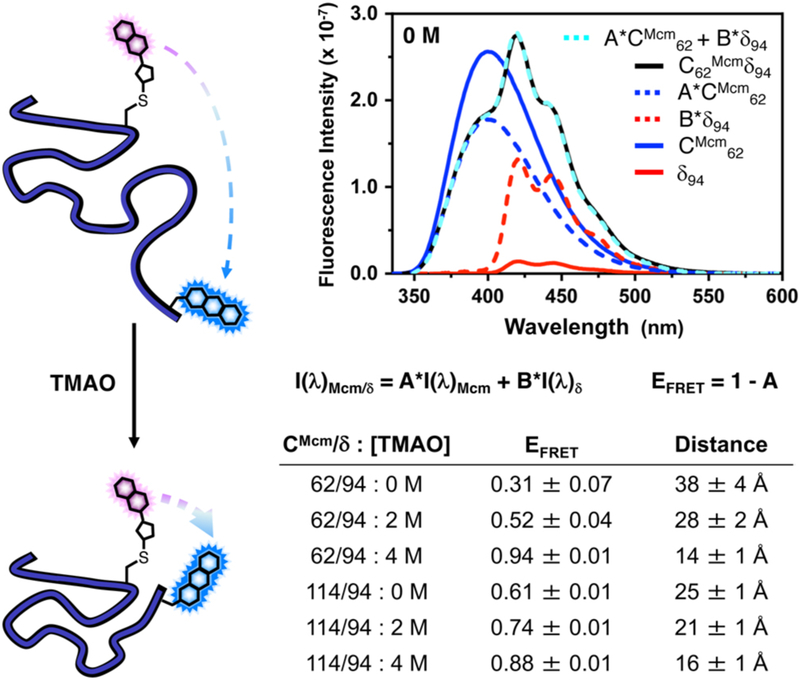
αS TMAO FRET Experiments. Left: Incubation of αS with TMAO causes protein compaction, which can be monitored by FRET. Top Right: Fluorescence emission spectra (325 nm excitation) of 1 μM concentrations of αS-CMcm62δ94 and the corresponding singly-labelled αS-CMcm62δ94 and αS-CMcm62δ94 constructs in 0 M TMAO. Deconvolution of the doubly labelled spectrum by fitting to a weighted sum of the singly-labelled spectrum are shown. Bottom Right: EFRET and corresponding inter-fluorophore distances for αS constructs under varying conditions determined using spectral deconvolution. See ESI for details.

