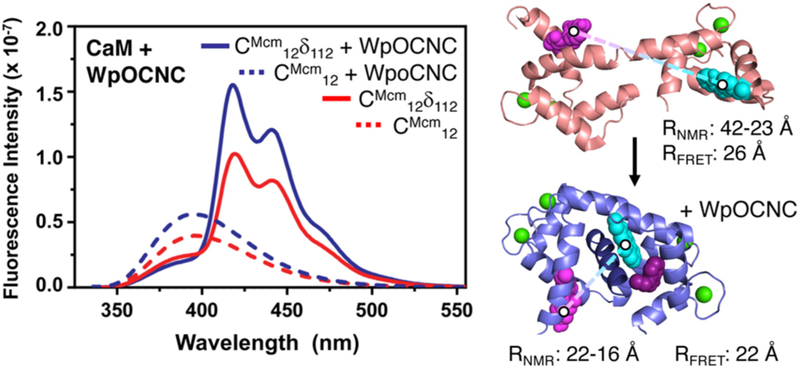
Fig. 4.
CaM Peptide binding FRET. Left: Fluorescence emission spectra of CaM-CMcm12δ112 (325 nm excitation) obtained in the presence and absence of the WpOCNC binding peptide. Note: The apparently small FRET change is the result of an opposing increase in Mcm emission upon binding. This can be accounted for by comparison to CaM-CMcm12 emission with and without WpOCNC. Full spectral deconvolution to obtain EFRET values is described in ESI. Right: Images of CaM in the presence an absence of the pOCNC peptide rendered from PDB entries 1X0220 and 1SY9,21 respectively. Distances obtained from EFRET measurements are consistent with the CaM conformations in these NMR studies when models of CMcm and Acd are included. See ESI for details.

