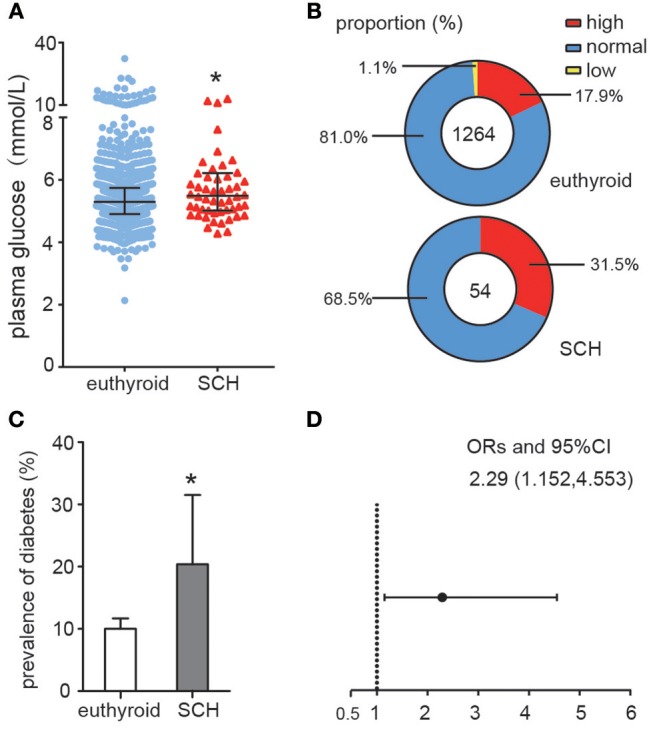
Figure 1.

Abnormal Glucose metabolism in SCH patients. (A) Plasma glucose distributions in different group (euthyroid controls and SCH patients), data were expressed as: median (P25, P75). (B) The proportion of the glucose categories in different group. (C) The prevalence of diabetes in different group. The error bars represent the 95% CI of the ratio. (D) The odds ratio of diabetes in different group.
