Figure 3.

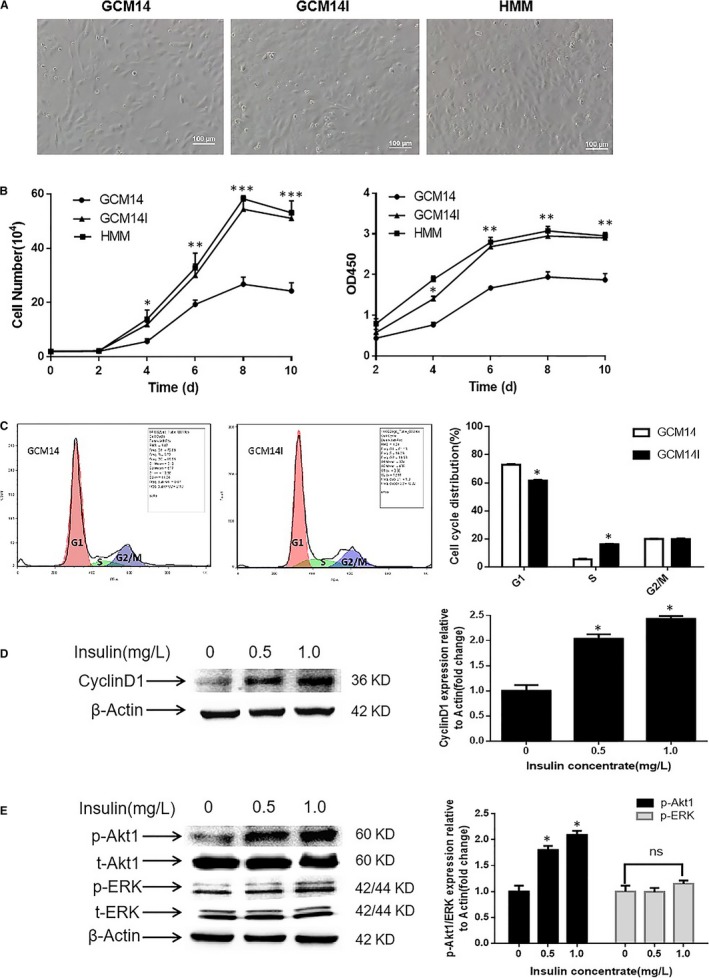
Effect of insulin on cell morphology, growth, viability, cell cycle distribution and the expression of related regulators in hiHeps. A, Photomicrograph of hiHeps cultured in GCM14 without or with 1.0 mg/L insulin and in HMM for 4 d (scale bar, 100 μm). B, Effect of insulin on the growth and vitality of hiHeps in various culture media over 10 d. C, hiHeps incubated in GCM14 with 0 and 1.0 mg/L insulin for 4 d were subjected to flow cytometry, and the percentages of cell cycle distribution (G1, S and G2/M) were measured. D, The expression level of cyclin D1 was determined by Western blotting (actin served as an internal control for protein loading). The bar graph shows the cyclin D1/β‐actin ratio and is expressed as the fold change compared with the control. E, The expression levels of phosphorylated Akt1 and ERK in hiHeps treated with 0, 0.5 and 1.0 mg/L insulin. All data are presented as means ± SD; n = 3 samples per experimental group. *P < 0.05, **P < 0.01, ***P < 0.001
