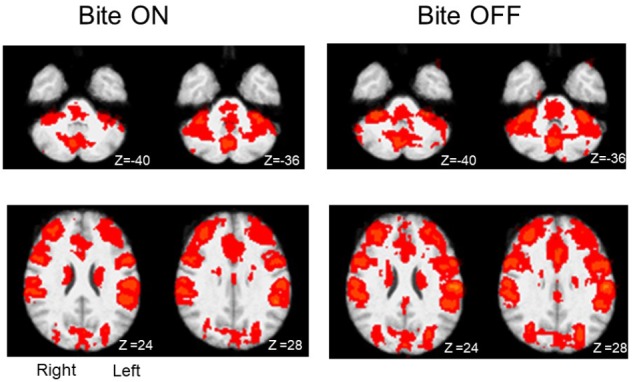
FIGURE 2.

Activation maps (task-rest) obtained during finger to thumb task in Bite ON and Bite OFF conditions. The red areas indicate regions characterized by significant activation during finger to thumb task in Bite ON and Bite OFF conditions. Right and left side are indicated in the section at Z 24, in the Bite ON column (the images are depicted from a bottom view). Upper row: cerebellum. Lower row: regions around the central sulcus. Z coordinates in mm in the MNI standard space are indicated under each section.
