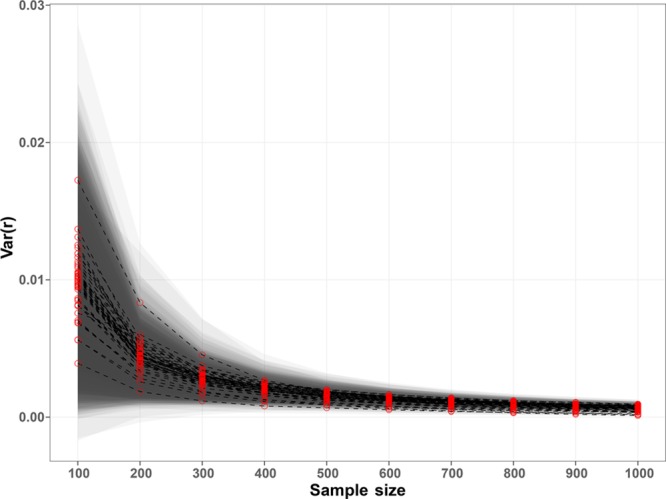
Figure 2.

Variance of the colocalization vectors values. The red dots represent the median of each MS image colocalization features calculated over the 500 repetitions using Np randomly sampled pixels. The bands represent the 1.4826 * MAD distance from the median. The plot shows that the variance of the colocalization features converged to zero with an increasing number of pixels, suggesting that the features were almost independent from the used pixels with samples larger than 300 pixels.
