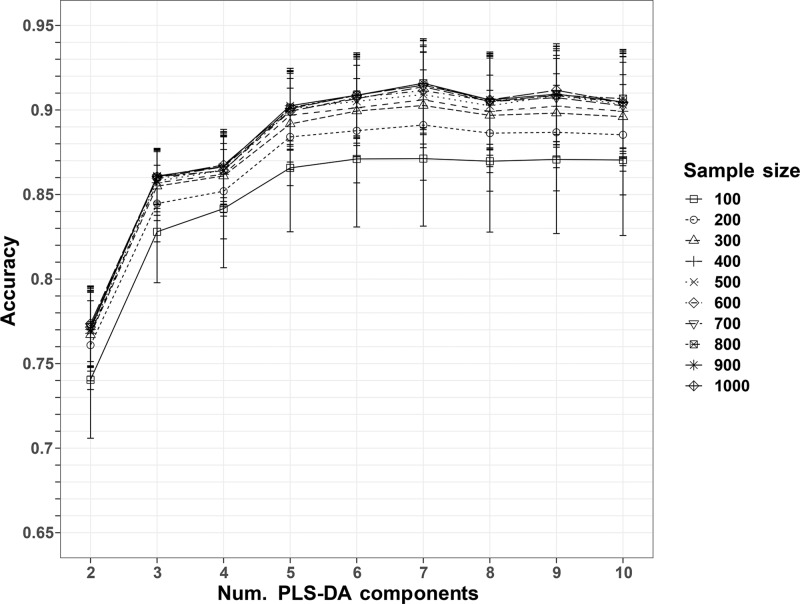
Figure 3.
Accuracies of the repeated PLS-DA classifications. The dots represent the average accuracies of the 10-fold cross-validation, repeated 500 times. The error bars represent the standard deviations. The maximum average accuracy corresponds to a sample size of 900 pixels and a number of PLS-DA components equal to 7.

