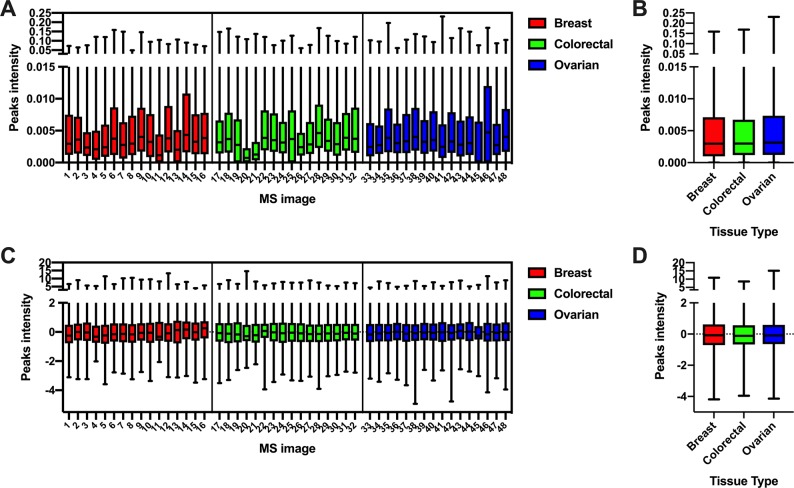
Figure 5.
Box plot of the preprocessed peak intensities of the 48 MS images belonging to the cross-validation set (A) and combined in the three main tissue types (B). A Kruskal–Wallis test resulted in a difference in the intensity distribution between the tissue types, at a significance level of 95%. After standardization (C, D), no significant difference was found between the peak intensities of the three tissue types.

