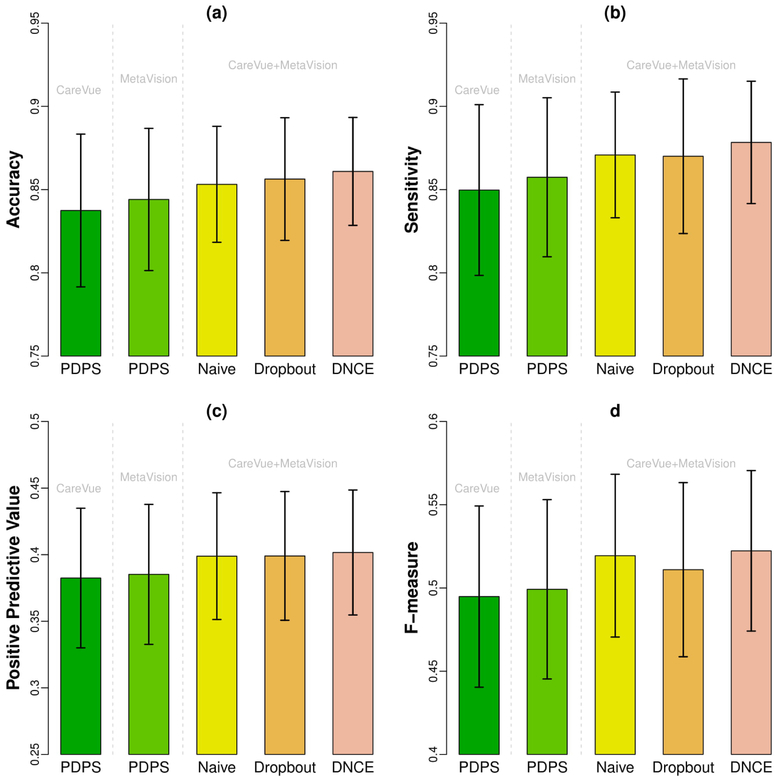
Figure 5.
Barplot of accuracy, sensitivity and positive predictive value with error bars. Figure (a) shows accuracy, Figure (b) shows sensitivity (recall), Figure (c) shows positive predictive value (precision) and Figure (d) shows the F-measure of existing method and the proposed methods. The height of bars represents the mean accuracy (or sensitivity/positive predictive value/F-measure) over 80 diagnoses of the corresponding methods. The error bars represent two times standard errors.

