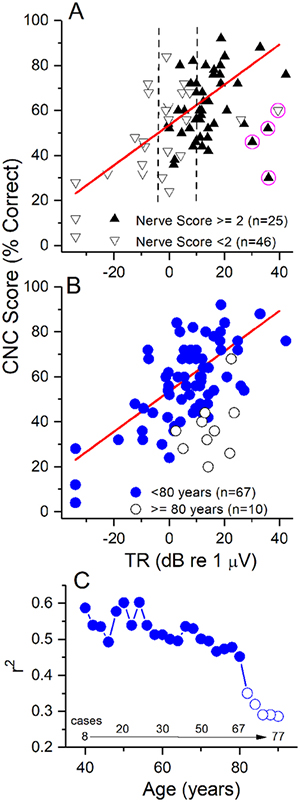
Figure 4.
Inclusion of nerve scores and the elderly. (A) Nerve scores. Cases with poor nerve scores (down triangles) were those with no evidence of ANN or CAP (nerve score=0), to one or the other being present but not prominent (nerve score =1). Cases with good nerve scores (up triangles were those where the CAP and ANN were present but not prominent, or one or the other was present and prominent (nerve score =2); to those where both were present and one was prominent (nerve score =3) to those where both were prominent (nerve score =4). Data is the same as in Fig. 3. Most case with large TRs (> 10 dB or 3.16 μV, right dashed line) had good nerve scores, while most cases with smalls with TRs (<−6 dB, or 0.5 uV) had poor nerve scores (down triangles). Cases in-between were mixed, but with no systematic distribution indicating poor nerve scores were associated with worse word score outcomes. (B) Addition of cases 80 years and older. For the younger adults only those cases included in the regression from Fig. 3are shown. Subjects 80 years and older generally had lower speech perceptions scores for a given TR, although there was overlap with the younger group. (C). A cumulative regression function where subjects with increasingly older ages were progressively added and the r2 recalculated. The r2 was >0.45 and relatively stable until subjects ≥80 years old were included, at which point it abruptly declined, ending at <0.3.

