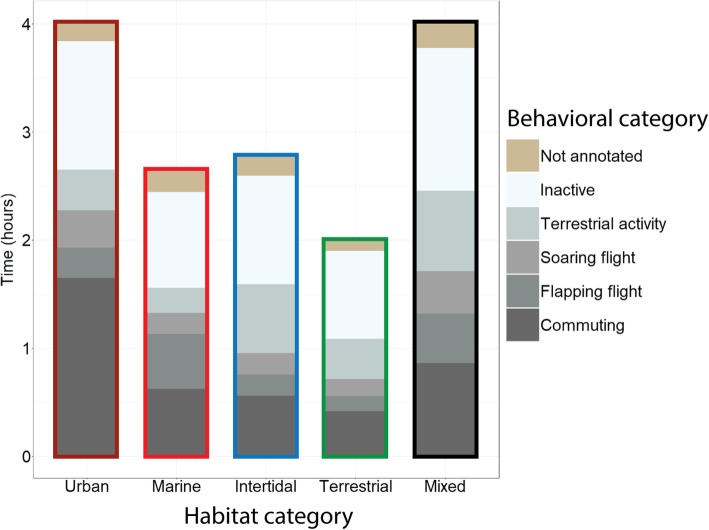
Fig. 3.
Trip duration and time spent (h) on the different behavioral categories per habitat category (n = 605 foraging trips). Trips on which individuals spent more than 50% in one habitat were assigned to main habitat category urban, marine, intertidal or terrestrial. Trips on which individuals spent less than 50% in one habitat were assigned to main habitat category mixed

