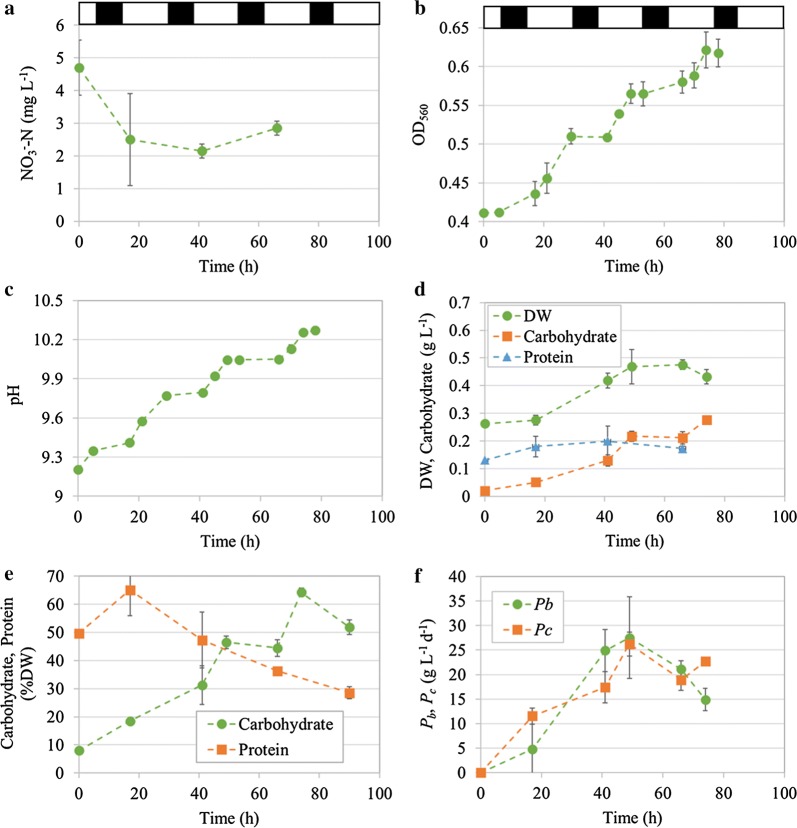
Fig. 2.
Nitrate consumption (a), cell growth (OD560, b), pH variations (c), biomass, carbohydrate or protein concentrations (d), carbohydrate or protein content (e), and biomass or carbohydrate productivity (f) of Arthrospira platensis cultivated under nitrogen-limited conditions in industrial-scale raceway ponds. The white and black regions on the top denoted natural light and dark periods of a diurnal cycle, respectively. The data represented the average values of two independent replicated cultivations and the bars showed the standard deviations (mean ± SD)

