Fig. 1.
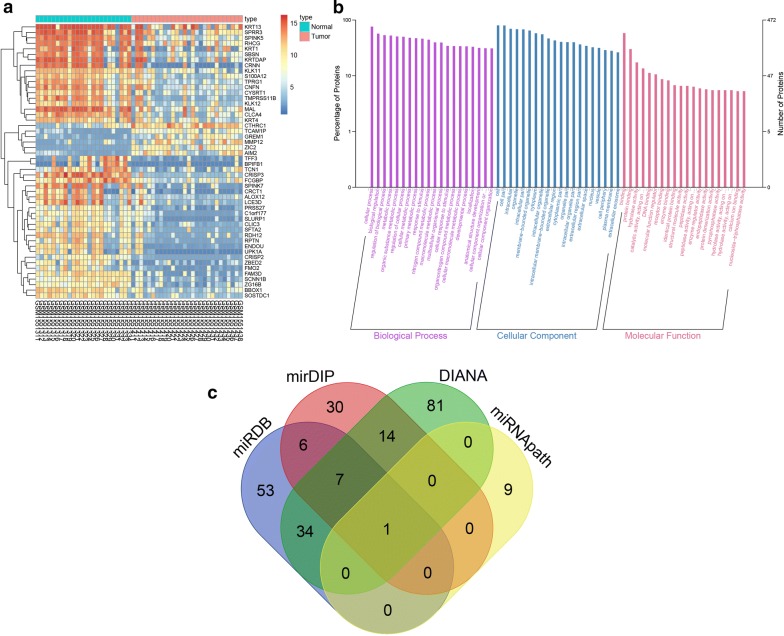
miR-137 is predicted to regulate the progression of CC via TGF-β1/smad pathway by binding to GREM1. a The heat map of the top 50 genes with the highest differential expression where the X-axis represents the sample number, the Y-axis represents genes. The left dendrogram indicates gene expression cluster in which each small square in the graph represents the expression of a gene in one sample, and the histogram of the upper right is the color gradation in which blue stands for low expression and red stands for high expression; b GO analysis of DEGs of GSE63514; the X-axis indicates the name of GO items, the Y-axis reflects the percentage of genes, the grape area represents biological process clustering, the blue represents cellular component clustering, the red signifies molecular function clustering; c the prediction result of miRNAs regulating GREM1 gene; the four different color ellipses represent the number of miRNAs regulating GREM1 in miRDB, mirDIP, DIANA, and miRNApath databases, and the overlapping section represents the intersection of each other, the central part represents the common intersection of 4 databases. miR-137 microRNA-137, CC cervical cancer, GREM1 gremlin-1, GO gene ontology, DEGs differentially expressed genes

