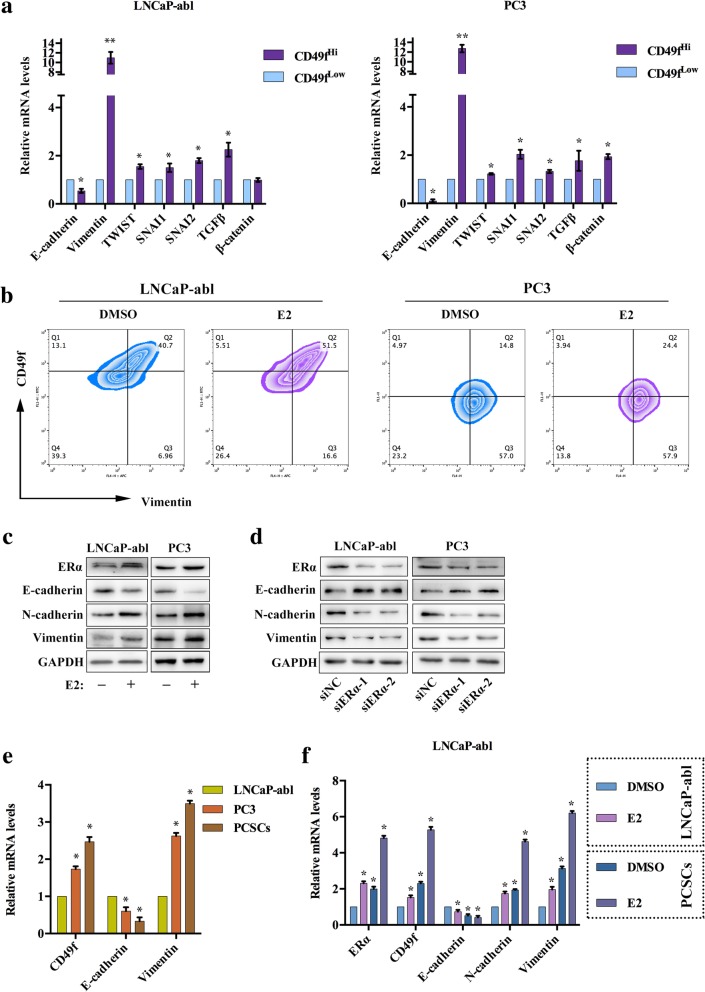
Fig. 2.
E2 promotes EMT in CD49fHi PCBSLCs. a, qRT-PCR analysis showing expression changes of the indicated genes in the sorted CD49fHi and CD49fLow PCBSLCs. The data are presented as the mean ± SD (n = 3). *, P < 0.05 vs. CD49fLow PCBSLCs. b, Flow cytometry analysis of the coexpression of CD49f and Vimentin in LNCaP-abl and PC3 cells treated with either DMSO or 10 nM E2 for 72 h (n = 3). c and d, Western blot analysis the indicated proteins in (c) LNCaP-abl or PC3 treated with DMSO or 10 nM E2 treatments for 72 h; (d) LNCaP-abl or PC3 with ERα knockdown (n = 3). e and f, qRT-PCR analysis showing expression changes of EMT markers in LNCaP-abl and enriched stem cell spheres of LNCaP-abl (PCSCs) (e), and treated with 10 nM E2 or DMSO (f). The data are presented as the means±SD (n = 3). *, P < 0.05 vs. DMSO

