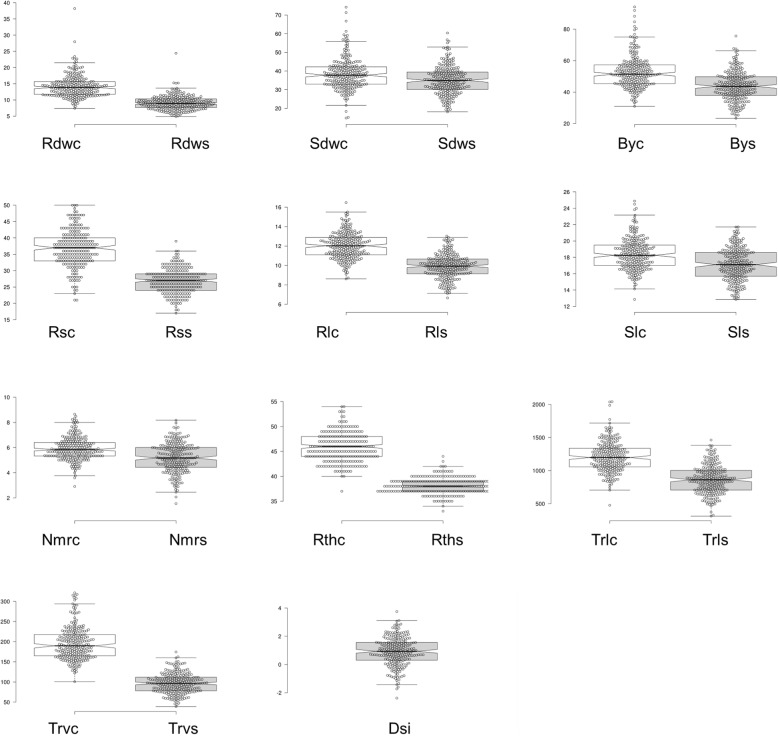
Fig. 1.
Box plots for root and seedling traits. Centre lines show the medians; box limits indicate the 25th and 75th percentiles as determined by R software; whiskers extend 1.5 times the interquartile range from the 25th and 75th percentiles, outliers are represented by dots; data points are plotted as open circles. Trait values for Rsc, Rss, Rthc and Rths are transformed by multiplying by 100 for visualizations

