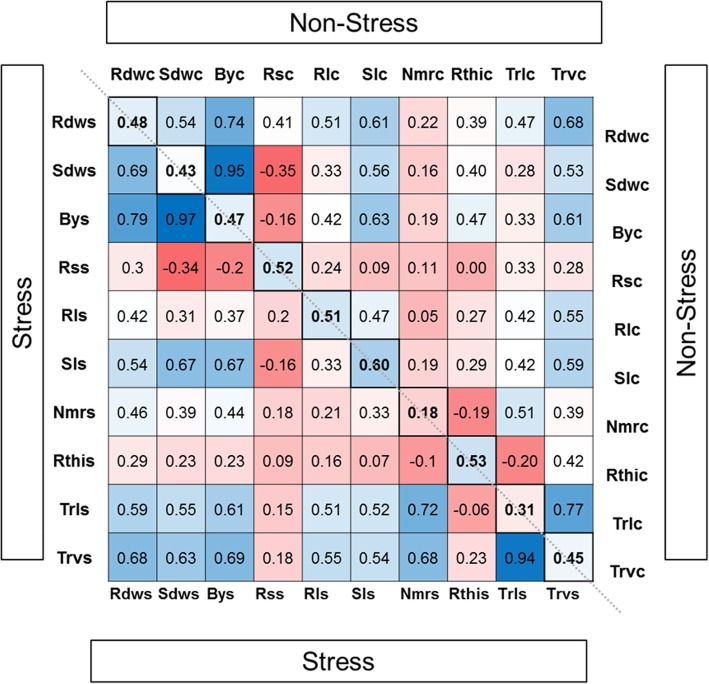
Fig. 2.
Correlations between root and seedling traits in non-stress or osmotic stress conditions. Correlations are displayed as heatmap and as numerical value. Red = negative correlation, blue = positive correlation. The part above the diagonal presents correlations of traits only within non-stress treatment and below the diagonal only within stress treatment. Along the diagonal correlations between the same trait in both treatment are displayed. Correlations values above 0.2 and below −0.2 are significant (P < 0.01)

