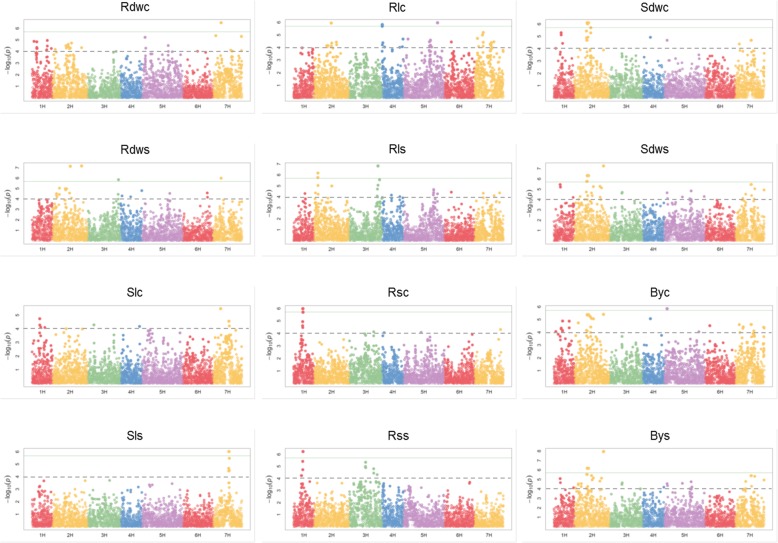
Fig. 3.
Manhattan plots of 12 out of 21 root and shoot traits. Horizontal axis presents seven chromosomes (1H–7H) of the barley genome. Vertical axis shows -log10(P) values of the marker-trait associations. Horizontal green line shows the threshold value based on FDR (0.05). Additionally, dashed line signifies threshold of -log(p) = 4.0

