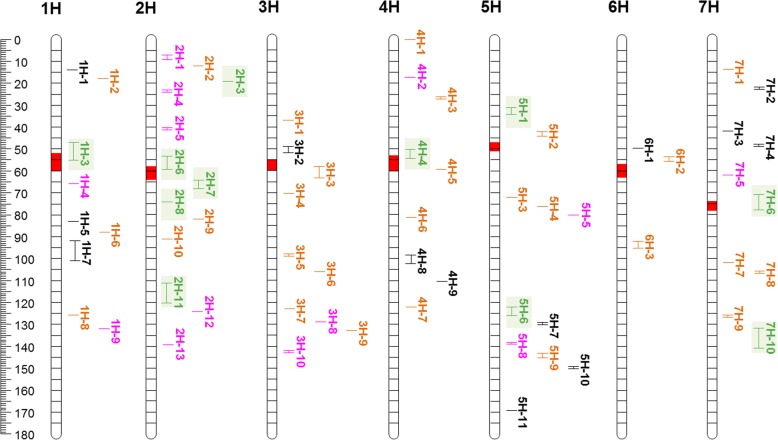
Fig. 5.
Genetic positions (cM) of 65 QTL regions for root and shoot seedling architecture placed on a schematic map of the seven barley chromosomes along with the corresponding QTL name (see Additional file 1: Table S5 for all details). QTL-hotspots are highlighted in green, root specific QTL in orange, stress-specific QTL in pink and the remaining non-specific QTL in black. Centromeric regions are indicated by red segments

