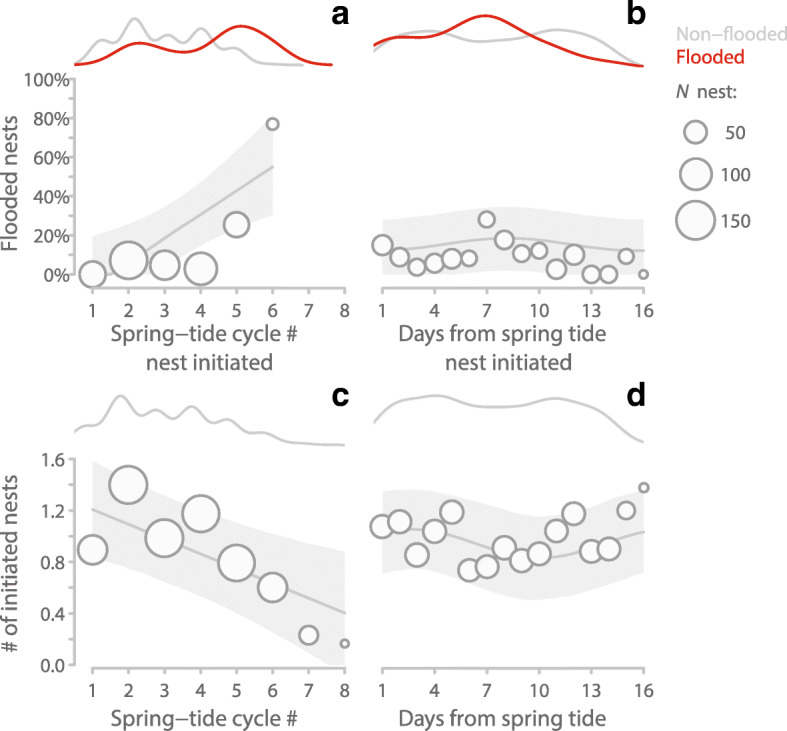
Fig. 5.

Nest flooding and initiation in relation to season and spring tide cycle. a-b, Percentage of flooded Snowy Plover nests in relation to time of the laying season, as indicated by spring tide cycle # (a), and in relation to day of spring tide cycle (b) when parents initiated their nest. Circles represent percentage of flooded nests initiated within each spring tide cycle (a) and within each day of the spring tide cycle (b). The lines at the top of the panels indicate Kernel-densities for non-flooded nests (grey) and flooded nests (red). N = 476 hatched, unhatched or flooded nests initiated by 266 females over ten years and six spring tide cycles. c-d, Number of initiated nests in relation to time of the laying season (c), and day within the spring tide cycle (d). Circles represent mean number of nests initiated for each spring tide cycle (c) or each day of the spring tide cycle (d). The lines at the top of the panels indicate Kernel-densities. N = 776 days from ten laying seasons encompassing 62 semi-lunar spring tide cycles. a-d, Circle size indicates the number of initiated nests in the particular spring tide cycle (a, c) or day (b, d). The lines and the shaded areas represent model predictions with 95% CI based on posterior distributions of 5000 simulated values generated from ‘simple Gaussian model’ outputs (Tables 1 and 2) using the ‘sim’ function in R [45] while keeping the other predictors constant. Note that in (a, b) the 7th semi-lunar cycle contained only two data-points and hence these were modeled as the 6th cycle
