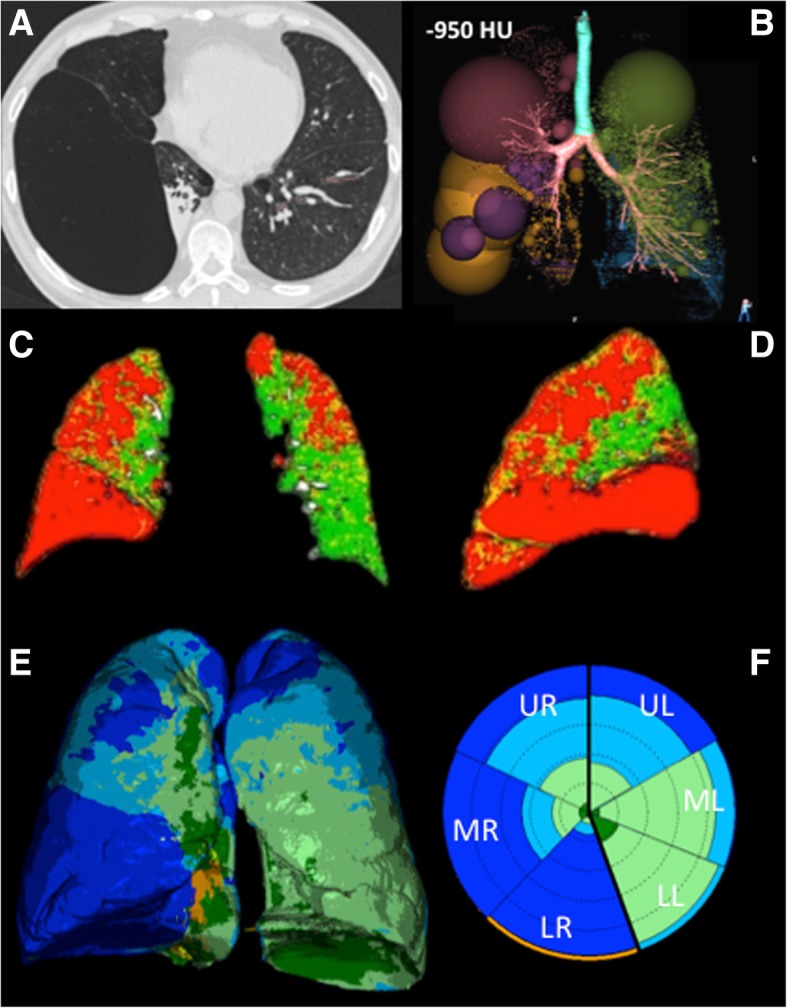
Fig. 1.

Lung parenchyma representations at CT scan after post-processing with different software programs in a patient with severe emphysema. a. Axial CT scan shows advanced destructive emphysema with a giant bulla in the right lower lobe adjacent to an area of passive atelectasis. b. Volume rendering of the densitometric analysis performed by VIDA shows the location and severity of emphysema at inspiratory scan (threshold -950HU) displaying spheres whose diameter is proportional to the relative volume of emphysema in each region. c-d. Coronal and Sagittal 2D images obtained by co-registration of inspiratory and expiratory CT scans by Imbio LDA show the location of emphysema (red), functional airways gas trapping (yellow), and normal lung (green). e. Volume rendering of the lung texture analysis performed by CALIPER shows the 3D distribution of the different lung patterns, including Normal (dark green), Mild Low Attenuation Area (LAA, light green), Moderate LAA (light blue), Severe LAA (dark blue), Ground-glass (yellow), Reticular (orange). The glyph f provided by CALIPER summarizes the location and amount of the different lung patterns. The overall area of the glyph represents the computed total lung volume, the partitions with thick radial lines illustrate the relative volumes of the left (L) and right (R) lungs, which are further divided with thin radial lines into three regions, each representing the upper (U), middle (M), lower (L) lung zones. In this patient severe LAA dominates in the right lower and middle lung zones, whereas middle and lower left zones are characterized by mild and moderate LAA
