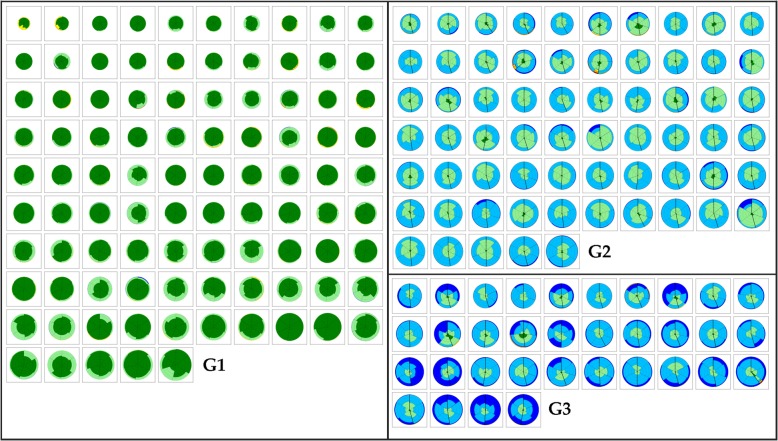
Fig. 2.
The three clusters of COPD patients stratified represented as glyphs. Clusters (G1 to G3) were the result of quantitative unsupervised clustering based on a dissimilarity matrix that captures the distribution of classified parenchymal patterns recognized by CALIPER. G1 was characterized by predominant Normal (dark green) and Mild LAA (light green) patterns, whereas G2 by predominant Moderate LAA (light blue) pattern and G3 by predominant Severe (dark blue) and Moderate LAA (light blue) patterns

