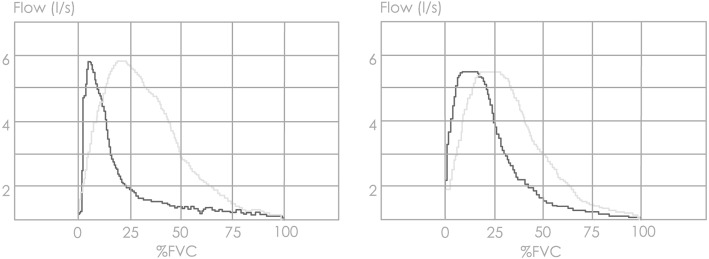
Fig. 4.
Maximal expiratory flow-volume curves of two representative subjects with severe emphysema or no emphysema. Patient with severe emphysema (left panel) had %LAA-950insp = 24 whereas the patient with no emphysema (right panel) had %LAA-950insp = 4 at CT. Note the flatter slope in the former when flow was plotted against expired volume (black lines) but not pletysmographic thoracic volume (grey lines), indicating greater thoracic gas compression at high-to-mid lung volumes

