Fig. 9.

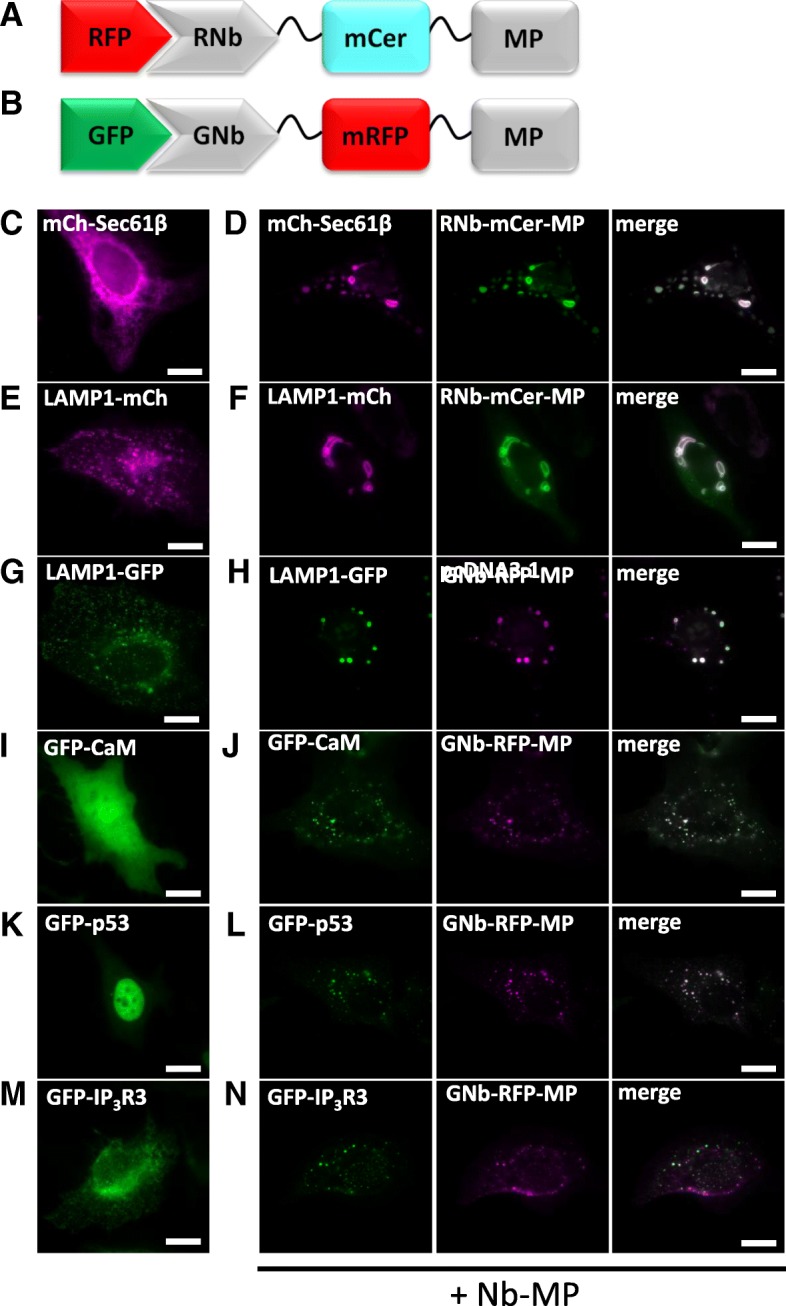
Clustering of RFP-tagged and GFP-tagged proteins and organelles using RNb-mCerulean-MP and GNb-mRFP-MP. a Schematic of RNb-mCerulean-MP fusion bound to RFP. b Schematic of GNb-mRFP-MP fusion bound to GFP. c–f HeLa cells expressing RFP-tagged proteins in the absence (c, e) or presence (d, f) of co-expressed RNb-mCerulean-MP (RNb-mCer-MP) were imaged using epifluorescence microscopy. g–n HeLa cells expressing GFP-tagged proteins in the absence (g, i, k, m) or presence (h, j, l, n) of co-expressed GNb-mRFP-MP were imaged using epifluorescence microscopy. Results are representative of at least 5 cells, from at least 3 independent experiments. Scale bars 10 μm
