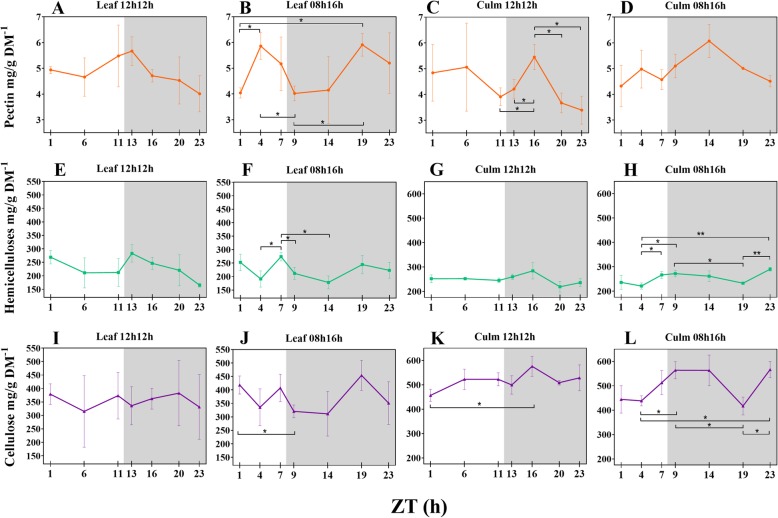
Fig. 1.
Diel fluctuation of cell wall components in response to photoperiods (a-l). Differences within means from each timepoint under each photoperiod and tissue were accessed by t-test. Bars connect significantly different timepoints. * P < 0.05; ** P < 0.01. Each point represents the mean ± SD (n = 3). Daytime (white) and night (light grey)

