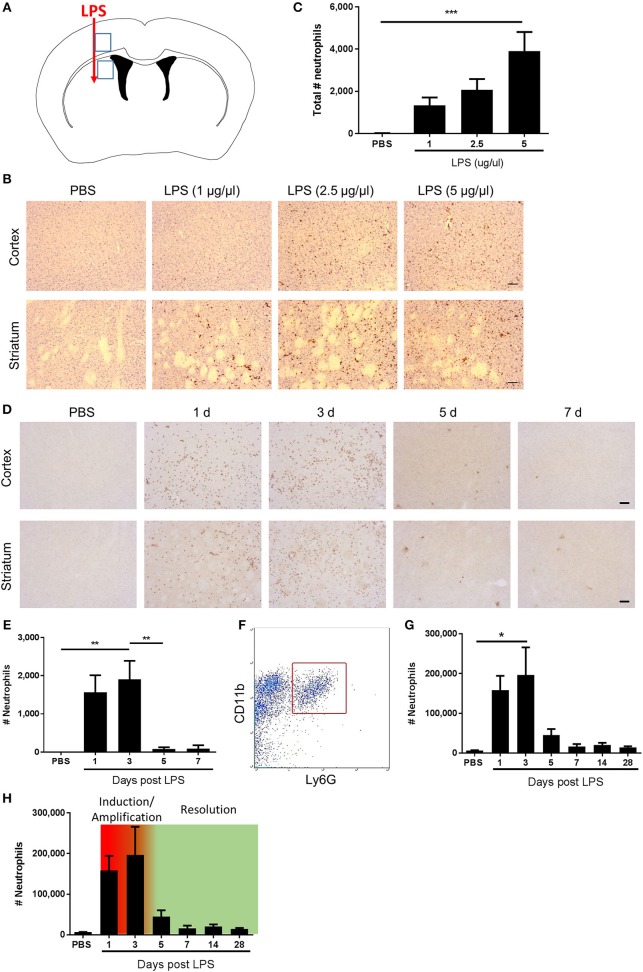
Figure 1.
Kinetics of neutrophil accumulation and loss define operational phases of the inflammatory response to intracerebral LPS challenge. (A) Schematic showing location of stereotaxic injections. Regions 1 and 2 indicate areas of cerebral cortex and striatum, respectively, shown in (B,D). (B) Representative immunostaining images of SJC4+ neutrophil accumulation in cortex (top) and striatum (bottom) (regions indicated in A) 24 h after LPS injection. Scale bar, 100 μm. (C) Quantification of the total number of SJC4+ neutrophils in the ipsilateral hemisphere 24 h after PBS or LPS injection. ***P < 0.001, one-way ANOVA with Dunnett's post-hoc test. N = 4–5 mice/group. (D) Representative immunostaining images of SJC4+ neutrophils in the cortex (top) and striatum (bottom) (regions indicated in A) following PBS or LPS injection and mice recovered up to 7 d. (E) Quantification of the total number of SJC4+ neutrophils following PBS or LPS injection and recovered up to 7 d. **P < 0.01, one-way ANOVA with Bonferroni's post-hoc test. N = 6 mice/group. (F) Flow cytometric identification of CD11b+ Ly6G+ neutrophils in brain cell suspensions. (G) Quantification of total number of CD11b+ Ly6G+ neutrophils following PBS or LPS injection and mice recovered for up to 28 d. *P < 0.05, one-way ANOVA with Bonferroni's post-hoc test. N = 4–7 mice/group. (H) Kinetics of neutrophil accumulation and loss following LPS injection shown in (G) overlaid with the timings for the phases defined operatively in the current study as inflammation initiation/amplification (1–3 d) and resolution (3–5 d).

