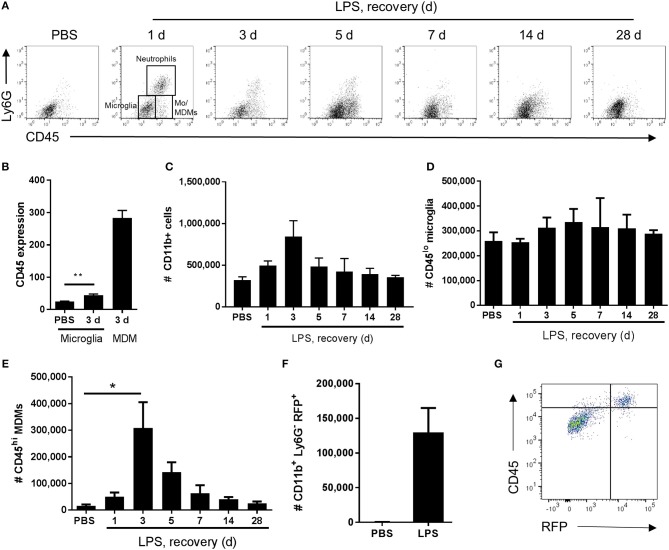
Figure 3.
Temporal profile of microglial and monocyte-derived macrophage recruitment after intracerebral LPS challenge. Brain cell suspensions were prepared from the ipsilateral hemisphere after intrastriatal PBS or LPS injection at indicated timepoints. (A) Representative flow cytometry dot plots and regions defining selected myeloid cell subsets (annotated at 1 d timepoint after LPS) based on Ly6G+ and CD45+ labeling (with pre-gating on CD11b+CD3− cells). Neutrophils were defined as Ly6G+CD45hi, microglia as Ly6G−CD45lo, and monocyte-derived macrophages (Mo/MDM) as Ly6G−CD45hi. Dot plots show representative changes in the composition of cell subsets as time progresses after LPS challenge. (B) Quantification of CD45 expression intensity in microglia 3 d after LPS with MDM expression shown for reference. **P < 0.01, Student's t-test. Quantification of the total number of (C) CD11b+ cells, (D) CD11b+CD3−Ly6G−CD45lo microglia, and (E) CD11b+CD3−Ly6G−CD45hi Mo/MDMs in the ipsilateral hemisphere after PBS or LPS injection. *P < 0.05, one-way ANOVA with Bonferroni's post-hoc test. (F) Quantification of the total number of CD11b+Ly6G−RFP+ MDMs after 3 d after intrastriatal PBS or LPS injection in Ccr2RFP/+ reporter mice. (G) Representative flow cytometry dot plot showing relationship between RFP and CD45 expression in brain cell suspensions from Ccr2RFP/+ reporter mice 3 d after intrastriatal LPS injection.

