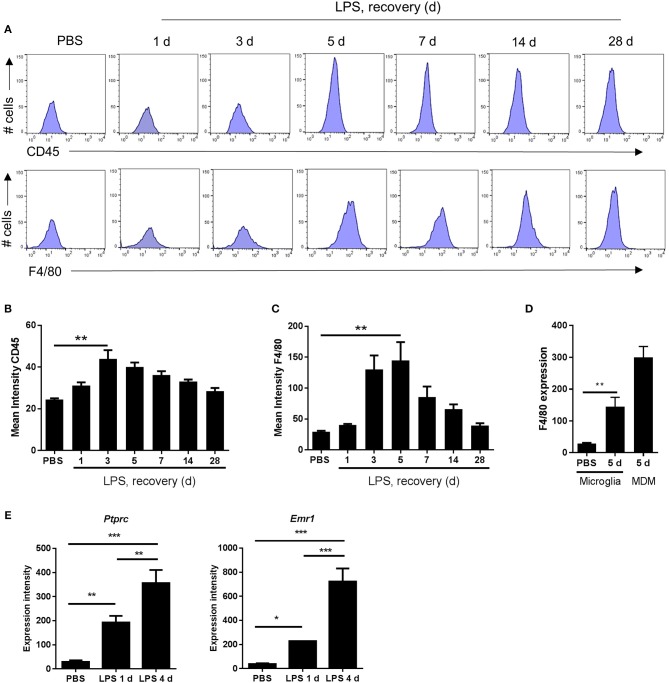
Figure 4.
Markers indicative of the magnitude of microglial reactivity peak at the onset of and during the resolution phase after intracerebral LPS challenge. (A) Brain cell suspensions were prepared from the ipsilateral hemisphere after intrastriatal PBS or LPS injection at indicated timepoints. Representative histograms showing expression of CD45 (top panel) and F4/80 (bottom panel) in CD11b+Ly6G−CD45lo microglia. Quantification of the mean fluorescence intensity of (B) CD45 and (C) F4/80 in CD11b+Ly6G−CD45lo microglia. **P < 0.01, Student's t-test (B); **P < 0.01, Mann–Whitney test (C), respectively. (D) Change in mean fluorescence intensity in CD11b+Ly6G−CD45lo microglia of F4/80 5 d after LPS compared to PBS shown with CD11b+Ly6G−CD45hi MDM CD45 intensity shown for reference. **P < 0.01, Mann–Whitney test. (E) Gene expression intensity of Ptprc and Emr1 measured by microarray from brain homogenates isolated from the ipsilateral hemisphere after intrastriatal PBS or LPS injection at indicated timepoints. *P < 0.05, **P < 0.01, ***P < 0.001; one-way ANOVA with Bonferroni's post-hoc test.

