Figure 5.
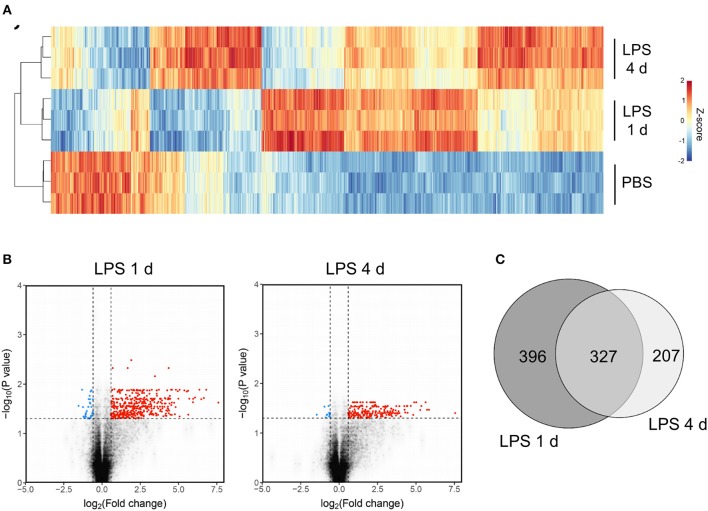
Transcriptome profiling identifies unique sets of genes induced at the induction and resolution phases of the inflammatory response after intracerebral LPS challenge. Brain homogenates were prepared from the ipsilateral hemisphere after intrastriatal PBS or LPS injection at indicated timepoints and transcriptome profiling by microarray performed. (A) Visualization by heat map of the 1779 transcripts differentially expressed across all treatment groups (ANOVA with FDR q < 0.05) and hierarchical clustering of samples according to the transcript expression patterns. Note the distinct modules of transcripts selectively altered 1 d (induction phase) and 4 d (resolution phase) after LPS injection. (B) Visualization of the transcripts differentially expressed 1 d or 4 d after LPS compared to PBS injection (FDR q < 0.05, fold-change ≥1.5) by volcano plot. (C) Venn diagram depicting the overlapping and unique transcripts significantly induced 1 d or 4 d after LPS compared to PBS injection (FDR q < 0.05, fold-change ≥1.5).

