
Figure 2.
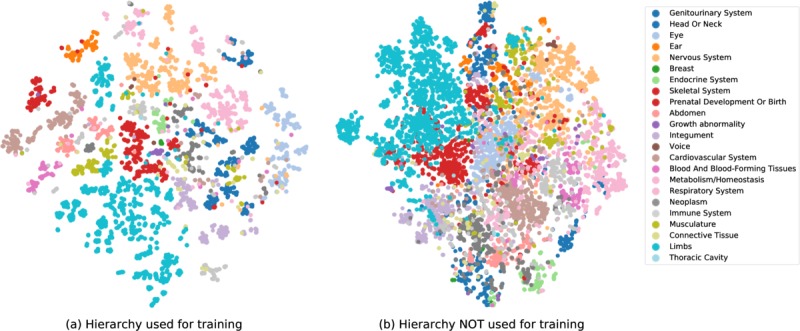
Visualization of the representations learned for Human Phenotype Ontology concepts. The representations are embedded into two dimensions using t-SNE. The colors denote the high-level ancestors of the concepts. The plot on the left shows the representations learned in NCR-N, where the taxonomy information was used in training, and the plot on the right shows representations learned for NCR-HN, where the taxonomy was ignored. NCR-HN: variation of the NCR model that ignores the taxonomy and has not been trained on negative examples; NCR-N: variation of the NCR model that has not been trained on negative samples; t-SNE: t-distributed stochastic neighbor embedding.