Figure 2.

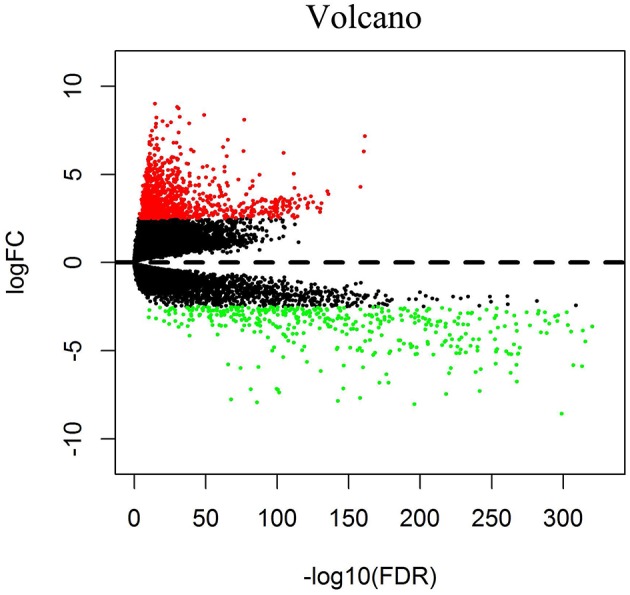
Volcano diagrams of BC-related differentially expressed DEGs. Red dots represent upregulated DEGs, and green dots represent downregulated DEGs.

Volcano diagrams of BC-related differentially expressed DEGs. Red dots represent upregulated DEGs, and green dots represent downregulated DEGs.