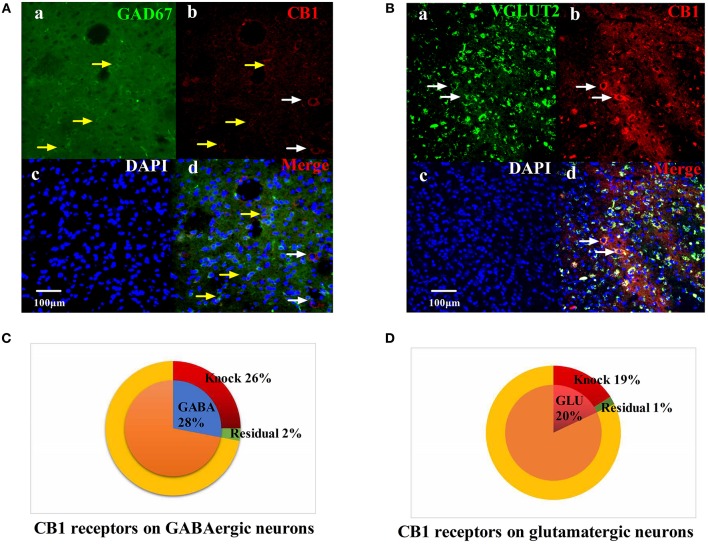
Figure 6.
Specific knockout of the CB1 receptor on GABAergic neurons localized in the vlPAG. (A) rAAV-mDlx-CRE-WPRE-pA was injected into the right side of the vlPAG of mCnr1flox/flox mice. (a) GABA-immunoreactive cellsin the vlPAG (green). (b) CB1-immunoreactive cells (red). (c) DAPI nuclear staining (blue). (d) GABA-immunoreactive and DAPI nuclear staining colocalization fluorescence (purple); Yellow arrows show CB1 receptors not knocked out on GABAergic neurons. White arrows show CB1 receptors not knocked out on other large diameter neurons. Scale bar, 100 μm. (B) rAAV-CaMKII-CRE-WPRE-pA was injected into the right side of the vlPAG of mCnr1flox/flox mice. (a) GLU-immunoreactive cells (green). (b) CB1-immunoreactive cells in the vlPAG (red). (c) DAPI nuclear staining (blue). (d) GLU-immunoreactive and DAPI nuclear staining colocalization fluorescence (purple); White arrows show CB1 receptors not knocked out on glutamatergic neurons. Scale bar, 100 μm. (C) Summary data show that the percentage of CB1-immunoreactive cells was knocked out in the area of GABA-immunoreactive cells. Blue sector, GABA-immunoreactive cells; red sector, CB1-immunoreactive cells were knocked out; green sector, residual cells. (D) Summary data shows the percentage of CB1-immunoreactive cells knocked out in the area of glutamatergic-immunoreactive cells. Pink sector, glutamatergic-immunoreactive cells; red sector, CB1-immunoreactive cells been knocked out; green sector, residual cells. Data are expressed as the means ± SEM (n = 3 mice in each group).

