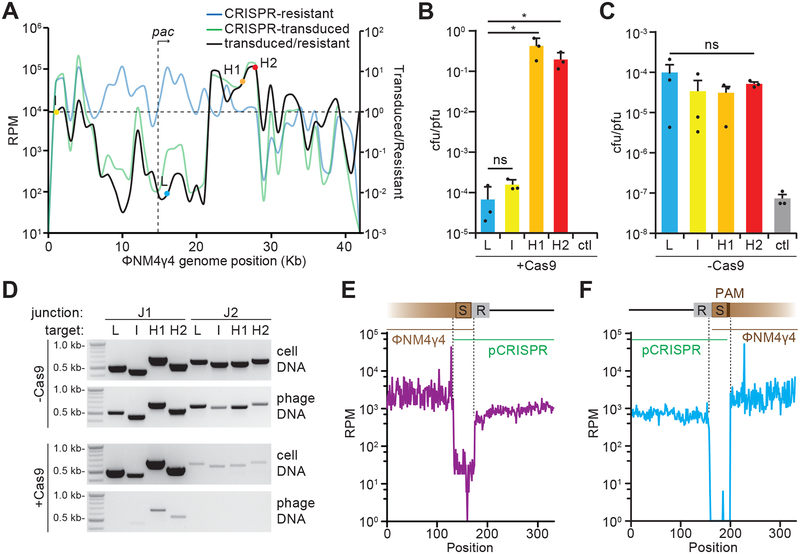
Figure 2. Spacers sequences determine frequency of pCRISPR transduction.
(A) Cultures containing pCRISPR were infected with ΦNM4γ4 at a MOI of 1. Expanded CRISPR arrays were analyzed by next generation sequencing. The reads per million (RPM) values of the acquired spacers were plotted against the ΦNM4γ4 genome (blue line, CRISPR-resistant). Lysates containing ΦNM4γ4 as well as pCRISPR transducing particles were collected at 20 hours post infection and were used to infect cells without CRISPR-cas at an MOI of 1. Cells were plated to collect pCRISPR transductants and their spacer content was analyzed by next-generation sequencing (green line, CRISPR-transduced). The ratio of transduced spacers over resistant spacers was also plotted for each acquired spacer (black line). Select spacers with low-(L), intermediate-(I), and high (H1, H2) ratios, along with phage pac site, are indicated. Mean of 4 replicates was reported. (B) Transduction efficiency, measured as the ratio of transductant colony forming units (cfu) to the total number of plaque forming units (pfu) of phage in the lysates obtained after infection of staphylococci harboring pCas9 carrying the L, I, H1 and H2 spacers, or no targeting spacer as a control (ctl). Mean + STD of 3 biological replicates are reported. Two-tailed unpaired t-test was used to calculate P values; ns, not significant (p = 0.1554), *p (H1) = 0.024, *p (H2) = 0.024 (C). Same as (B) but measuring the transduction of pSpacer plasmids; i.e. not carrying cas9. Mean + STD of 3 biological replicates are reported. One-way ANOVA was used to calculate P values; ns, not significant (p = 0.59). (D) PCR products after amplification of J1 and J2 junctions (Fig. 1C) either from lysates (phage DNA) or infected cells (cell DNA) obtained after infection of cells harboring pCas9 (+Cas9) or pSpacer (-Cas9) plasmids with L, I, H1 or H2 spacers. These results were representative of three independent experiments. (E) Next generation sequencing of phage DNA harvested after infection of cells pCas9(H1). Reads were aligned to the putative J1 junction. Reads per million (RPM) for each nucleotide within this region are shown. Dotted lines indicate a 75-nucleotide sequence that is unique to the junction. Results from a single experiment are shown. (F) Same as (E) but for the J2 junction. Results from a single experiment are shown.

