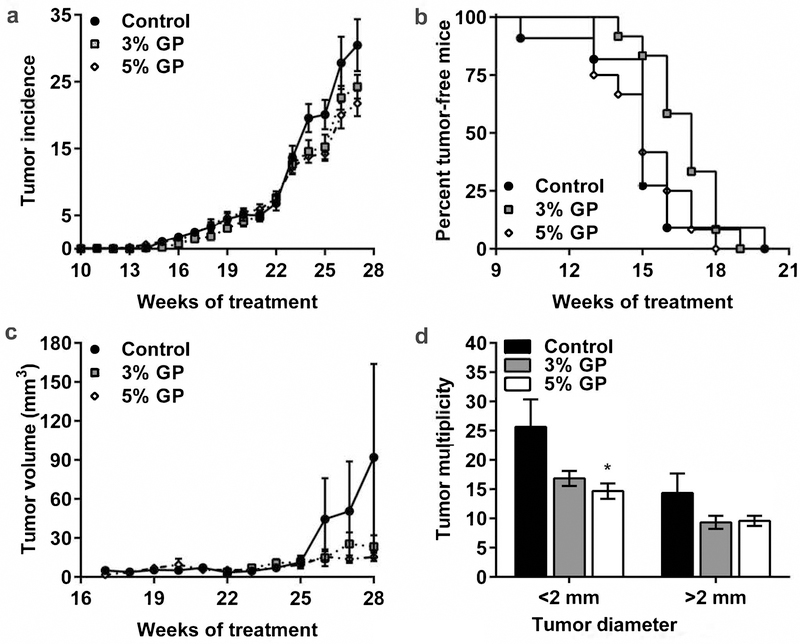
Figure 2. Effect of dietary GP on UVB-mediated skin carcinogenesis in SKH-1 hairless mice.
(a) Average tumor incidence per group. Statistical model is described in materials and methods, p-value 0.306 and 0.174 for 3% GP and 5% GP, respectively; (b) Kaplan-Meier plot of tumor-free mice, p-values 0.157 and 0.940 for 3% GP and 5% GP, respectively; (c) Average tumor volume per group for weeks 16 to 28, p-value 0.352 and 0.455 for 3% GP and 5% GP, respectively; (d) Tumor multiplicity at the time of euthanasia. For <2 mm tumors p-value 0.132 and 0.021 for 3% GP and 5% GP, and for >2 mm tumors p-value 0.331 and 0.505 for 3% GP and 5% GP, respectively. All data are presented as mean ± SEM.

