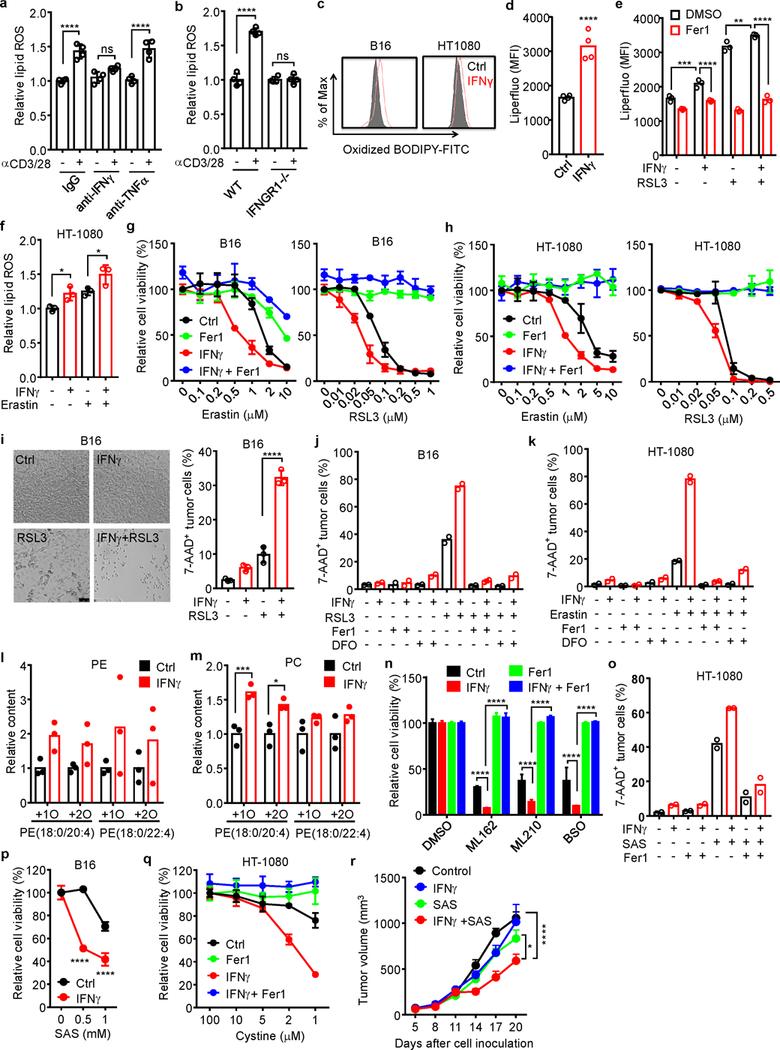
Extended Data Fig. 3. IFNγ sensitizes tumor cells to ferroptosis.

a, Relative lipid ROS in B16 cells treated with the supernatants from activated CD8+ T cells in the presence of anti-IFNγ or anti-TNFα blocking antibody for 40 hours. n = 4 biological replicates. ns, P = 0.1003; **** P < 0.0001 as determined by one-way ANOVA.
b, Relative lipid ROS in wild-type or IFNGR1 deficient (IFNGR1−/−) B16 cells treated with the supernatant from activated CD8+ T cells for 40 hours. n = 4 biological replicates. ns, P = 0.9981; **** P < 0.0001 was determined by one-way ANOVA.
c. Lipid ROS in B16 or HT-1080 cells treated with IFNγ for 24 hours. The representative histogram plot for fluorescent of oxidized C11-BODIPY is shown.
d, Mean fluorescence intensity (MFI) of LiperFluo in B16 cells treated with IFNγ for 24 hours. n = 4 biological replicates. **** P < 0.0001 as determined by two-tailed t-test.
e, MFI of LiperFluo in HT-1080 cells primed with IFNγ for 24 hours, followed with RSL3 (0.05 μM) for 6 hours in the presence of Fer1 (10 μM). n = 4 biological replicates. ** P = 0.0067; *** P = 0.0003 and **** P < 0.0001 were determined by two-way ANOVA.
f, Relative lipid ROS of HT-1080 cells primed by IFNγ (10 ng/ml) for 40 hours and followed with erastin (2 μM) treatment for 8 hours. n = 3 biological replicates. * P = 0.0426 or 0.0250 was determined by one-way ANOVA.
g-h, Relative viability of B16 (g) or HT-1080 (h) cells primed with or without (Ctrl) IFNγ for 40 hours in the presence of Fer1 (10 μM), followed by treatment with different concentrations of erastin or RSL3 for 24 hours. n = 3 or 4 biological replicates (mean ± s.d.).
i, The percentage of 7-AAD+ B16 cells primed by IFNγ (10 ng/ml) for 40 hours and followed with RSL3 (0.1 μM) treatment for 20 hours. Representative images were shown (left panel). Cell death was quantified by FACS after PI staining (right panel). n = 3 biological replicates. **** P < 0.0001 as determined by one-way ANOVA.
j, k, The percentage of 7-AAD+ B16 (j) or HT-1080 (k) cells primed by IFNγ and followed with RSL3 (0.1 μM in j) or erastin (4 μM in k) in the presence of Fer1(10 μM) or deferoxamine (DFO, 100 μM). n = 2 biological replicates.
l, m, Relative content of oxygenated phosphatidylethanolamine (PE) (l) and phosphatidylcholine (m) species in HT-1080 cells primed by IFNγ (10 ng/ml) for 48 hours. n = 3 biological replicates. *** P = 0.0008 and * P = 0.0167 were determined by two-tailed t-test.
n, Relative viability of HT-1080 cells primed by IFNγ for 24 hours, followed by ML162 (0.1 μM), ML210 (0.1 μM), or BSO (5 μM) for 24 hours in the presence of Fer1 (10 μM). n = 3 (mean ± s.d.), **** P < 0.0001 as determined by two-way ANOVA.
o, The percentage of 7AAD+ HT-1080 cells primed by IFNγ, followed with SAS (0.5 mM) for 40 hours in the presence of Fer1 (10 μM). n = 2 biological replicates.
p, Relative viability of B16 cells primed by IFNγ for 24 hours, followed with different concentrations of sulfasalazine (SAS) for additional 24 hours. n = 3 (mean ± s.d.).**** P < 0.0001 as determined by two-way ANOVA.
q, Relative viability of HT-1080 cells primed with or without IFNγ, then cultured with medium supplemented with decreased concentrations of cystine in the presence of Fer1 (10 μM) for 20 hours. n = 3 or 4 biological replicates (mean ± s.d.).
r, Effect of IFNγ and SAS on HT-1080 tumor growth in vivo. HT-1080 cells (2 × 10⁶ cells) were subcutaneously inoculated into NSG mice. Mice were treated either with IFNγ (1.5 × 10⁵ U/ mice), SAS (120 mg/kg) or the combination. n = 5 animals in each group. * P < 0.05 and **** P < 0.0001 were determined by two-way ANOVA.
