. 2018 Jun 4;40(2):201–205. doi: 10.1590/2175-8239-JBN-3882

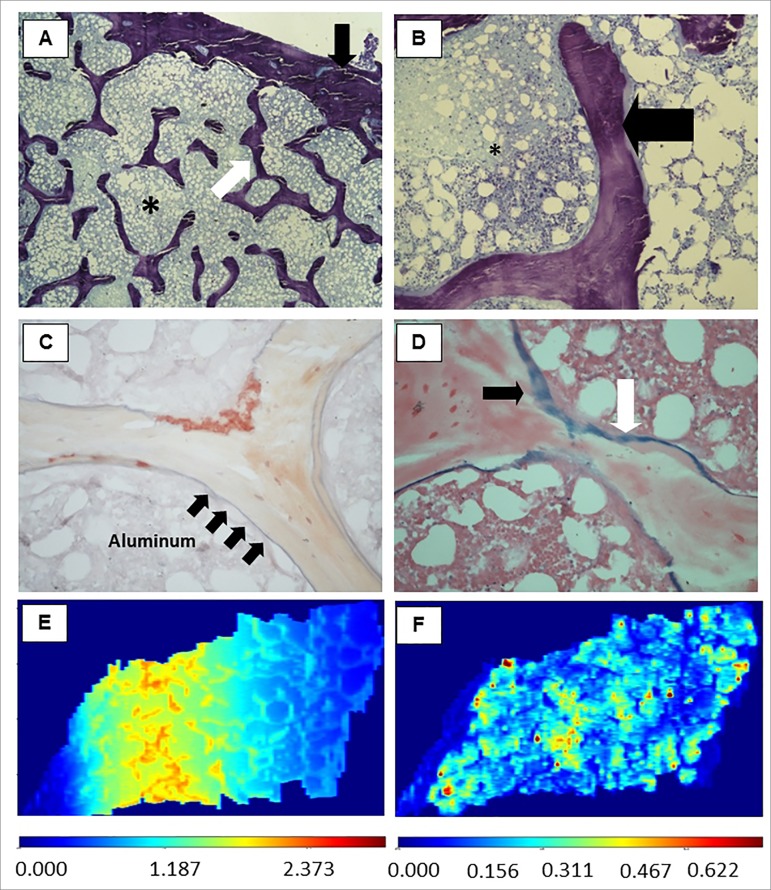
Figure 1. Representative images of bone tissue. (A) Thin cortical and trabecular bone with an increased trabecular separation (x40 magnification). (B) Trabecular bone with osteoid (x400). (C) Solochrome azurine staining revealing in blue (black arrows) the aluminum deposition in bone interface (mineralization front) along almost the entire trabeculae (x400); (D) Pearls staining revealing deposits of iron predominantly in trabecular bone. *bone marrow; black arrows: cortical bone; white arrows: trabecular bone; black broad arrow, osteoid; arrows: black, Al deposition in Figure 1C and iron deposition in Figure 1D. Images of bone tissue showing the deposition of Al and Fe, constructed by LA-iMageS software with data obtained from the analysis of LA-ICP-MS. (E) Distribution of Al predominantly in trabecular bone tissue; (F) Distribution of Fe predominantly in bone marrow. Sidebars refer to the intensity of the elements present in the tissue: high intensity (dark red and red) or low intensity (dark blue and blue), in-between: average intensity.

Figure 1