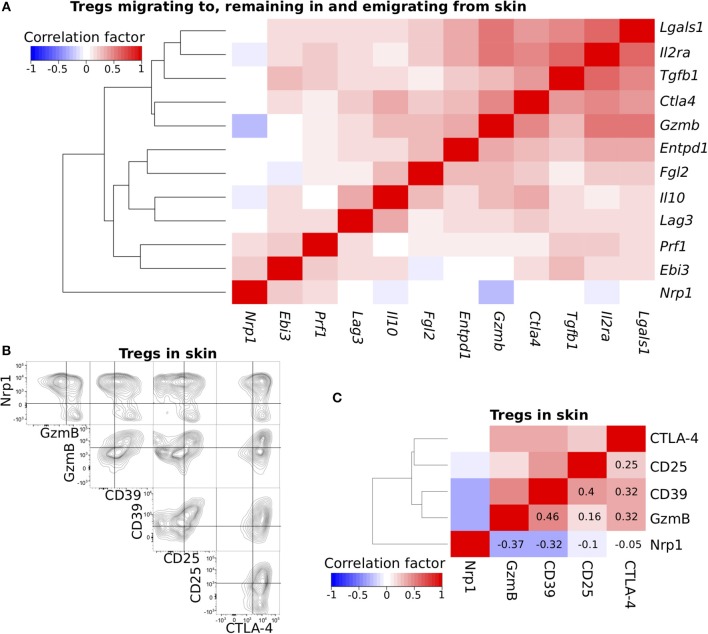
Figure 2.
Cross-correlation analysis of functional molecule expression profiles. (A) Cross-correlation analysis of the expression profiles for genes related to Treg function. scqPCR data was formed by concatenating the data from the three Treg populations. Colors indicate positive (red) or negative (blue) correlations. (B) Nrp1, GzmB, CD39, CD25, and CTLA-4 protein expression levels of Tregs in inflamed skin. Flow cytometry (FCM) data are representative of three independent experiments. Lines in plots indicate boundaries between positive and negative cells. (C) Cross-correlation analysis of the expression profiles for five proteins using pooled FCM data (n = 3). Clustering was performed by the Manhattan distance and group average method.

