
FIGURE 4.
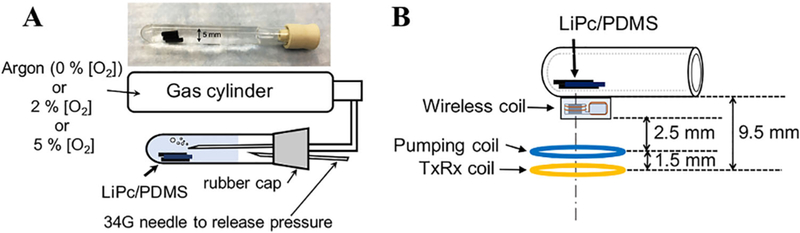
A, Experimental setup to investigate the relation between oxygen concentration and linewidth. For each oxygen concentration, the respective gas mixture is purged for 1 hour and the then the wireless coil measurements are made. To release the pressure in the tube, 34G needle was also put through the rubber cap. B, Describes how each of the coils are placed physically. The sample is ~ 9.5 mm from the EPR surface coil