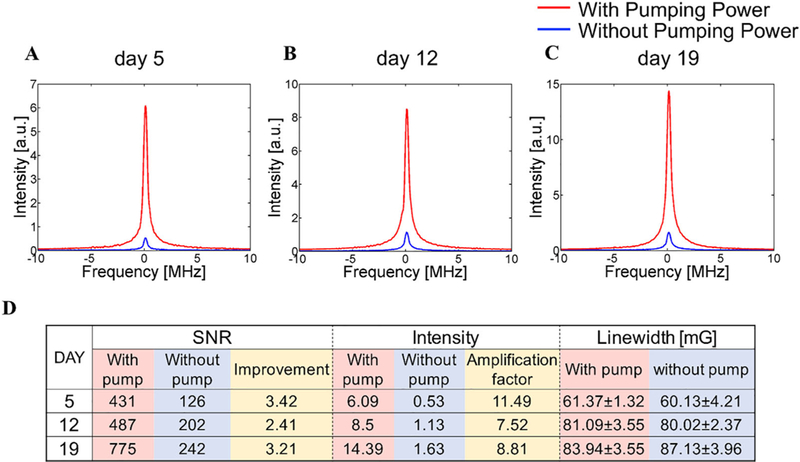
FIGURE 7.

A-C, Spectrum collected in different days after the implantation of wireless coil. D, Detail data of the spectrum acquired on each day. In the column of linewidth data, each value shows mean ± SD. On each day, the improvement of SNR and intensity was achieved without changes in linewidth compared with the results acquired without pumping power. In addition, the wireless coil kept working 19 days in animal body
