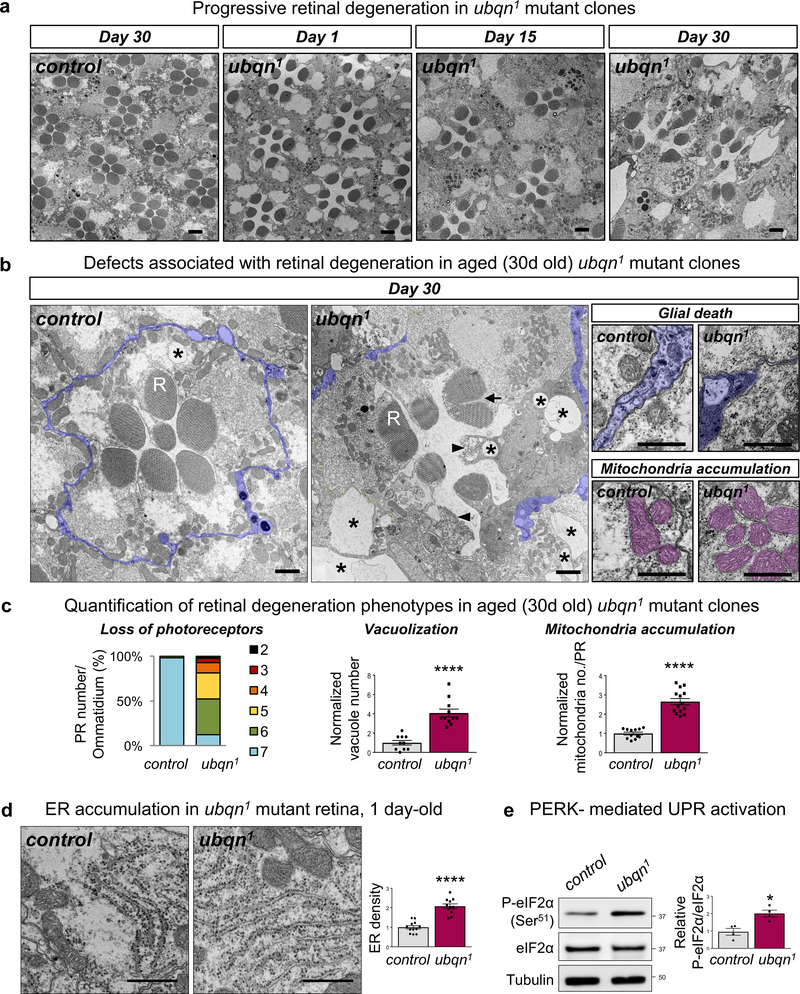
Fig. 2. Ubqn Is Required for Neuronal Function and Maintenance.
(a) TEM images of the retinae of ey-FLP clones of ubqn1; GR (control) and ubqn1 raised in 12h light/12h dark cycle, at 1 day-old, 15 days-old, and 30 days-old. Scale bars, 2 μm.
(b) Higher magnification TEM images of the retinae of ey-FLP clones of ubqn1; GR (control) and ubqn1 raised in 12h light/12h dark cycle, at 30 days old. R stands for rhabdomere. ubqn1 retina displays degenerating photoreceptors, vacuolization (asterisks), rhabdomere loss (arrowheads), splitting rhabdomeres (arrow), glial death, and mitochondria accumulation. Glial cells are highlighted in purple and mitochondria are highlighted in magenta. Scale bars, left panels 1 μm, right panels 0.5 μm.
(c) Quantification of photoreceptor number per ommatidium (n= 53 (control), n= 42 (ubqn1) ommatidia from 3 biologically independent animals), vacuole number (n= 10 (control), n= 11 (ubqn1) images (7 ommatidia/image) from 3 biologically independent animals), and mitochondria number (n= 10 (control), n= 11 (ubqn1) ommatidia from 3 biologically independent animals) of TEM images from (b). Mean ± s.e.m. ****p< 0.0001.
(d) TEM images of the ER in the retinae of 1 day-old ey-FLP clones of ubqn1; GR (control) and ubqn1 with quantification of normalized ER length (μm)/area (μm2). Scale bars, 0.5 μm. n= 12 (control), n= 11 (ubqn1) images from 3 biologically independent animals. Mean ± s.e.m for vacuole and mitochondria number, and mean for quantification of % PR number/ommatidium. ****p< 0.0001.
(e) Western blot for Phospho-eIF2α (S51) and total eIF2α with protein lysates from third instar larvae of ubqn1; GR (control) and ubqn1 with quantification of Phospho-eIF2α (S51) to total eIF2α ratio in ubqn1; GR (control) and ubqn1. n= 4 biologically independent samples. Mean ± s.e.m. ns, not significant; ***p= 0.0009.
For all panels, three independent experiments were performed with similar results. All statistics were determined by two-sided Student’s t-test. Statistics source data for Fig. 2c-e can be found in Table S9.

