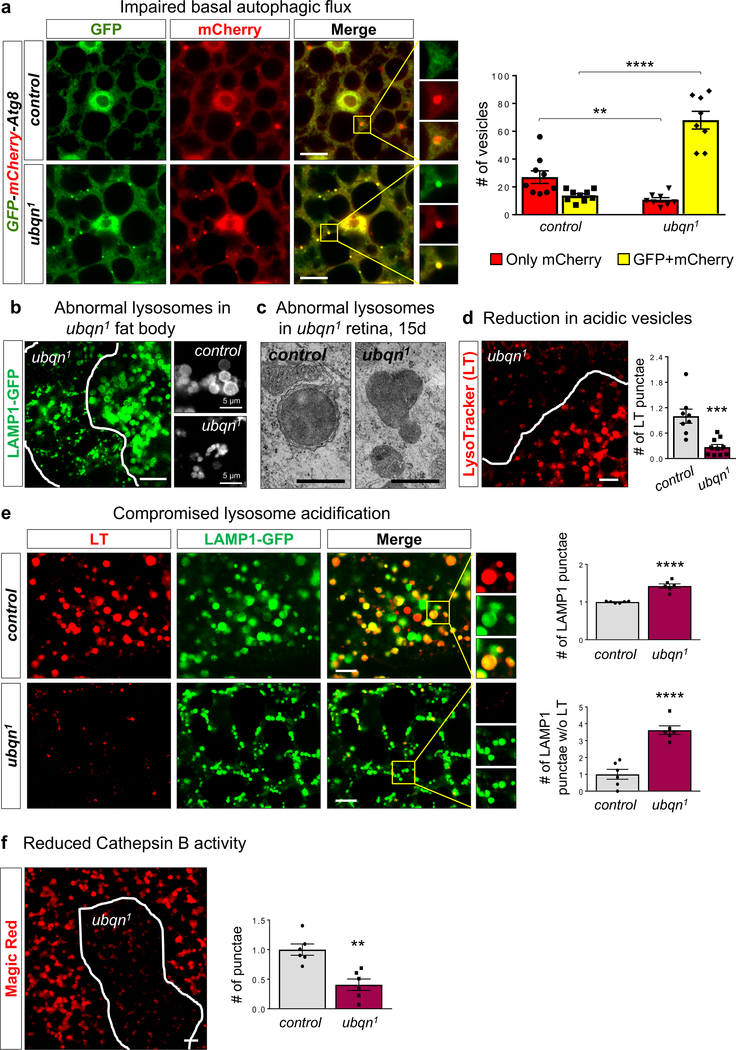
Fig. 4. Ubiquilin Facilitates Lysosomal Acidification and Function.
(a) Confocal images of fed early third instar larval fat body of y w (control) and ubqn1 expressing UAS-GFP-mCherry-Atg8a driven by Cg-GAL4 (drives expression in the fat body, hemocytes, and lymph gland) and quantification of only mCherry expressing and GFP+mCherry expressing punctae/section (135μm2). Scale bars, 10 μm. n= 9 (control), n= 8 (ubqn1) biologically independent samples. Mean ± s.e.m. **p= 0.006, ****p< 0.0001.
(b) ubqn1 clone in fat body of third instar larvae expressing UAS-LAMP1-GFP with Cg-GAL4 driver and higher magnification of LAMP1-GFP punctae to the right. Scale bar, 20 μm.
(c) TEM images of lysosomes in 15 day-old retinae of ey-FLP clones of ubqn1; GR (control) and ubqn1. Scale bar, 0.5 μm.
(d) Live imaging for LysoTracker (LT) dye in third instar larval fat body with ubqn1 clones and quantification of normalized LT punctae number/μm2 in ubqn1 clones compared to the surrounding wild-type cells. Scale bar, 10 μm. n= 8 (control), n= 10 (ubqn1) biologically independent samples. Mean ± s.e.m. ***p = 0.0004.
(e) Live imaging for LysoTracker (LT) in third instar larval fat bodies of iso (control) and ubqn1 expressing UAS-LAMP1-GFP with Cg-GAL4 driver and quantification of the normalized number of lysosomes (LAMP1-GFP punctae)/μm2 and the number of lysosomes without LysoTracker/μm2. Scale bars, 10 μm. n= 6 biologically independent samples. Mean ± s.e.m. ****p< 0.0001.
(f) Live imaging for Magic Red dye that detects active Cathepsin B in third instar larval fat body with ubqn1 clones and quantification of the number of punctae. Scale bar, 10 μm. n= 6 biologically independent samples. Mean ± s.e.m. **p = 0.0014.
For all panels, three independent experiments were performed with similar results. All statistics were determined by two-sided Student’s t-test. Statistics source data for Fig. 4a, d, e, and f can be found in Table S9.

