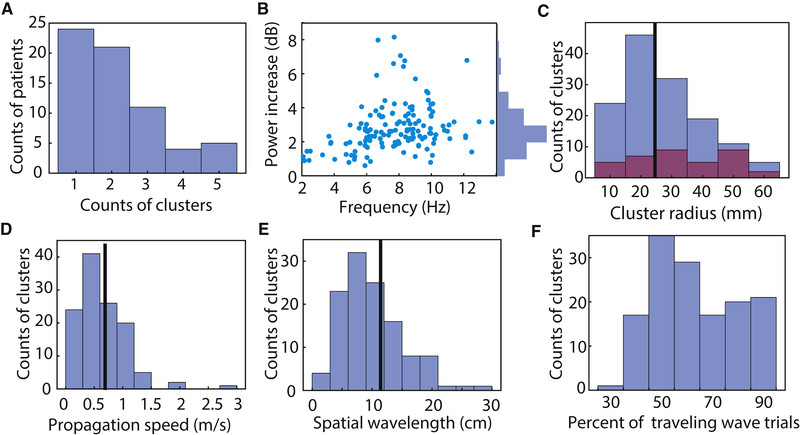
Figure 3: Population summary statistics on traveling waves.
(A) Histogram showing the counts of electrode clusters per patient that showed significant traveling waves. (B) Distribution of the narrowband power (relative to 1/ f) of traveling waves. (C) Distributions of estimated spatial radius across traveling-wave clusters. Purple bars indicates data from grid electrodes; other bars come from strips. Black line indicates median. (D) Distributions of propagation speed across clusters. (E) Distribution of wavelength. (F) Distribution of the mean percentage of time when individual clusters showed reliable traveling waves at the single-trial level.

