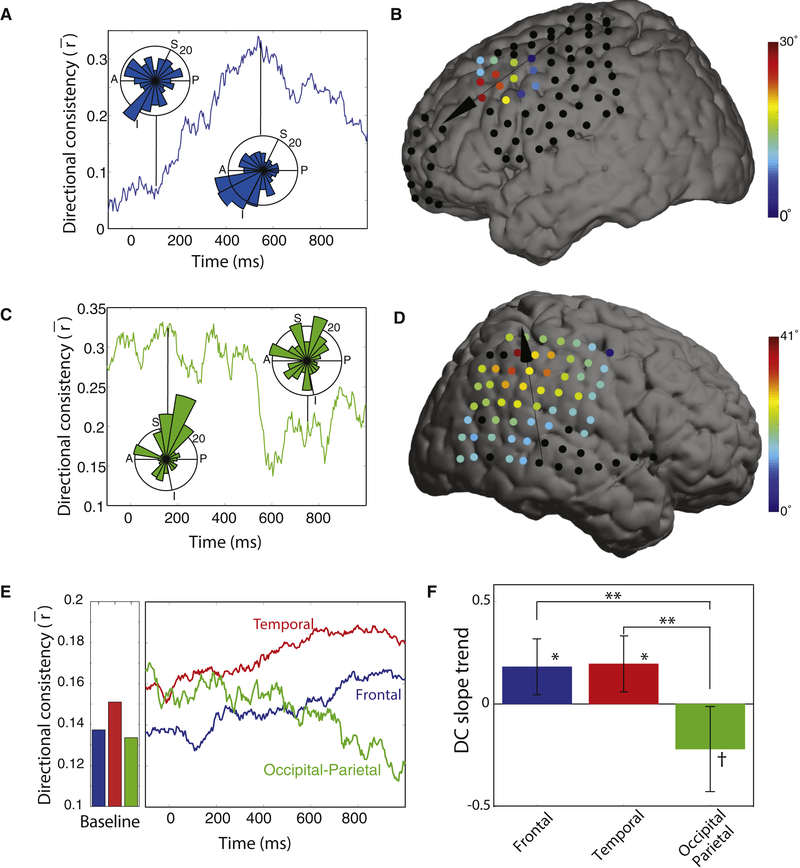
Figure 4: Temporal dynamics of traveling waves.
(A) Timecourse of directional consistency (DC) for a traveling wave at 12.5 Hz from Patient 26’s frontal lobe. Inset circular histograms indicate the distributions of propagation directions across trials at the labeled timepoints. (B) Brain plot showing the mean relative phase shift at each electrode at the timepoint of peak consistency for the same subject as Panel A. (C & D) Traveling 6.2-Hz parietoccipital wave from Patient 13, which showed a decrease in DC after cue onset. (E) Timecourse of traveling-wave DC. Bars indicate the mean DC for each region when patient is out of task. (F) Analysis of DC slope. Positive values indicate that DC increases following cue onset. Error bars denote 95% confidence intervals. Post-hoc test: ** denotes p < 0.01; *, p < 0.05; †, p < 0.1

