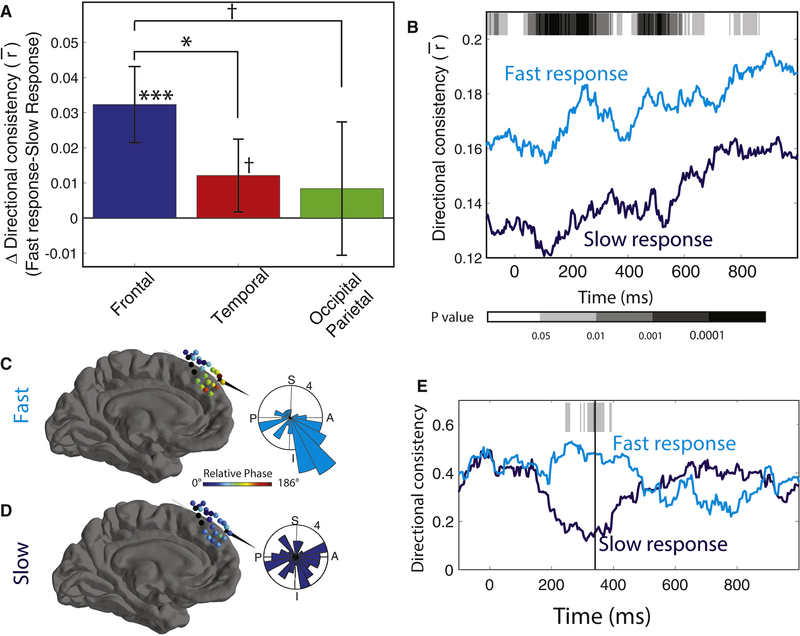
Figure 5: Traveling waves and behavior.
(A) Mean difference in DC between fast and slow trials for 1 s after cue onset, separately calculated for each region. (B) Timecourse of mean DC in the frontal lobe between fast and slow trials. Gray shading indicates significance (paired t tests). (C) Brain plot showing the mean relative phase distribution across an oscillation cluster in Patient 3. Inset plot shows distribution of propagation directions across trials 220 ms after probe onset. (D) Same as C, for trials where the patient responded slowly. (E) Time course of DC for data from Patient 3 that demonstrated elevated DC during trials where the patient responded rapidly. Shading indicates p values from a non-parametric circular direction comparison test (Fisher, 1993) between fast and slow response trials. Post-hoc test: *** denotes p < 0.001; *, p < 0.05; †, p < 0.1.

