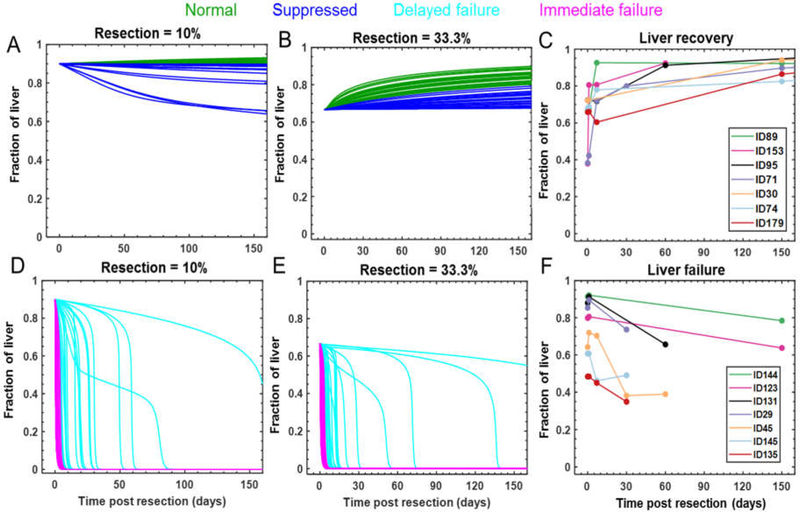
Figure 2.
Regeneration profiles of virtual patients depicting two types of liver recovery (Normal and suppressed) for different levels of resection (A) 10% resection (B) 33.3% resection (C) Volumetric liver data from Yamamoto et al. [1] for patients that exhibited liver recovery. Response modes of virtual patients that underwent delayed and immediate liver failure for (D) 10% resection (E) 33.3% resection (F) Volumetric liver data for patients showing liver failure from Yamamoto et al. [1].

