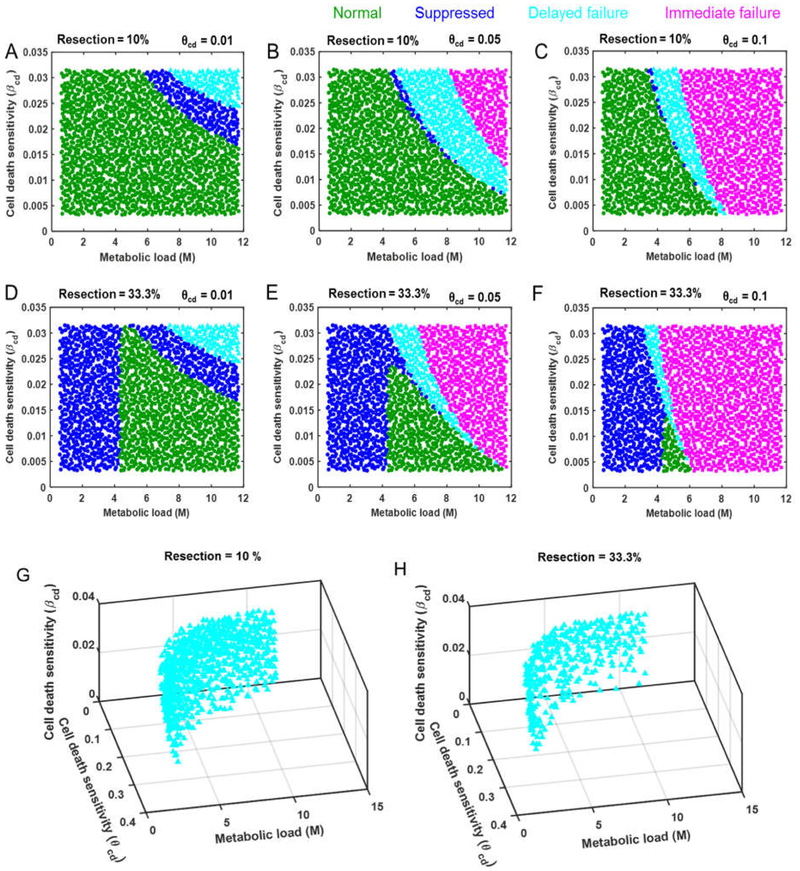
Figure 3.
(A–F) Two-dimensional distribution of response modes of virtual patients sampled over a range of metabolic load (M) and cell death sensitivity (βcd), for increasing levels of cell death sensitivity (θcd) at (A–C) 10% and (D–F) 33.3% resection. (G,H) Parameter space of the three controlling parameters showing the distribution of virtual patients with delayed liver failure post hepatectomy for 10% and 33.3% resection, respectively. Each marker represents a virtual patient.

