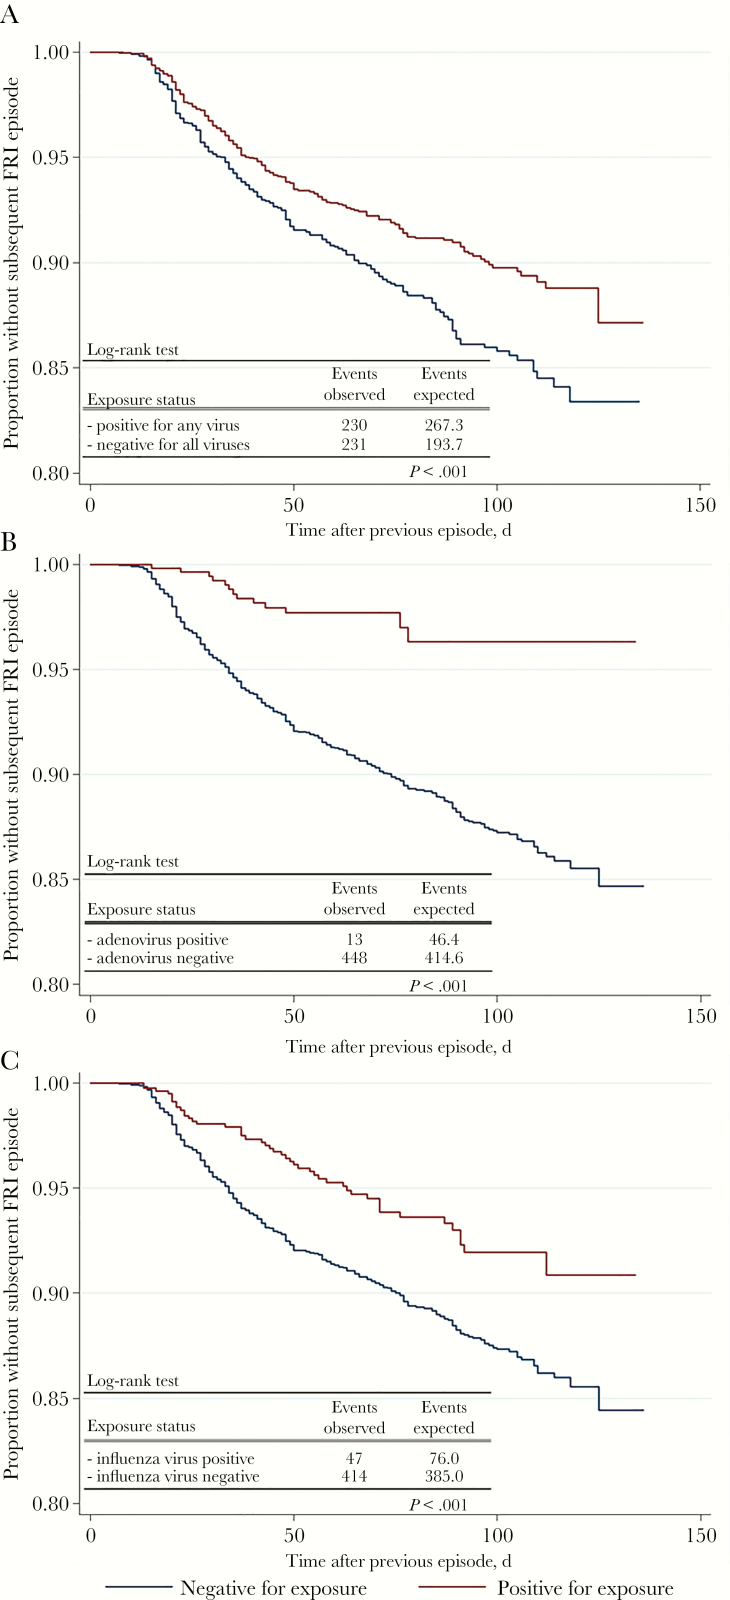
Figure 3.
Kaplan-Meier plots of the risk of a subsequent febrile respiratory illness (FRI) episode over time, by virological status of the previous FRI episode. A, Exposure status for any panel virus. B, Exposure status for adenovirus. C, Exposure status for influenza virus. P values were calculated by log-rank tests to compare observed and expected events among participants who tested positive or negative for the respective virus group.

